We have started a series of articles on tips and tricks for data scientists (mainly in Python and R). In case you have missed:
Python
1.How to Get The Key of the Maximum Value in a Dictionary
d={"a":3,"b":5,"c":2}

(max(d, key=d.get))
b2.How to Sort a Dictionary by Values
Assume that we have the following dictionary and we want to sort it by values (assume that the values are numeric data type).
d={"a":3,"b":5,"c":2}

# sort it by value
dict(sorted(d.items(), key=lambda item: item[1]))
{'c': 2, 'a': 3, 'b': 5}If we want to sort it in descending order:
dict(sorted(d.items(), key=lambda item: item[1], reverse=True))
{'b': 5, 'a': 3, 'c': 2}3.How to Shuffle your Data with Pandas
We can easily shuffle our pandas data frame by taking a sample of fraction=1, where in essence we get a sample of all rows without replacement. The code:
import pandas as pd

# assume that the df is your Data Frame
df.sample(frac=1).reset_index(drop=True)
4.How to Move a Column to be the Last in Pandas
Sometimes, we want the “Target” column to be the last one in the Data Frame. Let’s see how we can do it in Pandas. Assume that we have the following data frame:
import pandas as pd

df = pd.DataFrame({'A':[1,2,3],
              'Target':[0,1,0],
              'B':[4,5,6]})

df

Now, we can reindex the columns as follows:
df = df.reindex(columns = [col for col in df.columns if col != 'Target'] + ['Target'])
df

5.How to Circular Shift Lists in Python
We can use the roll method to the numpy arrays. It also supports both directions and n steps. For example:
import numpy
x=numpy.arange(1,6)
numpy.roll(x,1)
array([5, 1, 2, 3, 4])Or, if we want to get 2 steps backward:
x=numpy.arange(1,6)
numpy.roll(x,-2)
array([3, 4, 5, 1, 2])6.Replace Values Based On Index In Pandas Dataframes
You can easily replace a value in pandas data frames by just specifying its column and its index.
import pandas as pd
import dataframe_image as dfi

df = pd.DataFrame({'A': [1,2,3,4],
                   'B':['A','B','C','D']})

Having the dataframe above, we will replace some of its values. We are using the loc function of pandas. The first variable is the index of the value we want to replace and the second is its column.
df.loc[0,"A"]=20

df.loc[1,"B"]="Billy"

The loc function also lets you set a range of indexes to be replaced as follows.
df.loc[0:2,"A"]=100

7.How to Generate Requirements.txt For Your Python Project Without Environments
When I’m working on a new python project I just want to open the jupyter notebook in a new folder and start working. After the project is done, sometimes we have to create a requirements.txt file that contains all the libraries we used in the project so we can share it or deploy it on a server.
This is so annoying because we have to create an environment and then re-install the libraries we used so we can generate the requirements file for this project.
Fortunately, there is a package called PIGAR that can generate the requirements file for your project automatically without any new environments.
Installation
pip install pigar
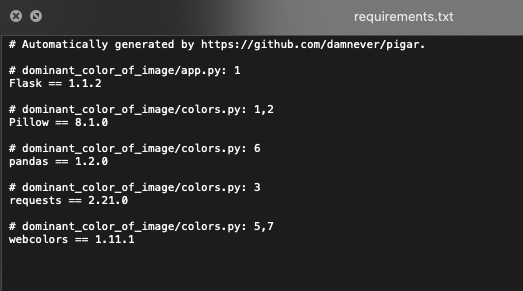
Let’s use it for a project. You can clone the dominant color repo and delete its requirements file. Then, open your terminal, head over the projects folder, and run the following:
pigar
Simple as that. You should see that a new requirements.txt file is generated with the libraries used for the project.

8.How to Generate Random Names
When we generate random data, sometimes there is a need to generate random names, like full names, first names and last names. We can achieve this with the names library. You can also specify the gender of the name. Let’s see some examples:
For example:
pip install names

import names
names.get_full_name()
'Clarissa Turner'

names.get_full_name(gender='male')
'Christopher Keller'

names.get_first_name()
'Donald'

names.get_first_name(gender='female')
'Diane'

names.get_last_name()
'Beauchamp'
9.How to pass the column names with Pandas
Sometimes we get file names without headers. Let’s see how we can read the csv file with pandas by specifying that there are not any headers and to define the column names. We will work with the fertility dataset obtained from IC Irvine.
The txt file looks like this:

where as you can see there are no headers. Let’s read it with pandas:
import pandas as pd

headers = ['Season', 'Age', 'Diseases', 'Trauma', 'Surgery', 'Fever', 'Alcohol', 'Smoking', 'Sitting', 'Output']
fertility = pd.read_csv('data/fertility_diagnosis.txt', delimiter=',', header=None, names=headers)

fertility

R
10.How to estimate the Standard Deviation of Normal Distribution
You can encounter this type of questions during the interview process for Data Scientist positions. So the question can be like that:
Question: Assume that a process follows a normal distribution with mean 50 and that we have observed that the probability to exceed the value 60 is 5%. What is the standard deviation of the distribution?
Solution:
\(P(X \geq 60) = 0.05\)
\(1- P(X < 60) = 0.05\)
\(P(X < 60) = 0.95\)
\(P(\frac{X-50}{\sigma} < \frac{60-50}{\sigma}) = 0.95\)
\(P(\frac{X-50}{\sigma} < \frac{10}{\sigma}) = 0.95\)
\(Z(\frac{10}{\sigma})= 0.95\)
But form the Standard Normal Distribution we know that the \(Z(1.644854)=0.95\) (qnorm(0.95) = 1.644854), Thus,
\(\frac{10}{\sigma} = 1.644854\)
\(\sigma = 6.079567\)
Hence the Standard Deviation is 6.079567. We can confirm it by running a simulation in R estimating the probability of the Normal(50, 6.079567) to exceed the value 60:
set.seed(5)
sims<-rnorm(10000000, 50, 6.079567 )
sum(sims>=60)/length(sims)
[1] 0.0500667As expected, the estimated probability for our process to exceed the value 60 is 5%.


