

We have started a series of articles on tips and tricks for data scientists (mainly in Python and R). In case you missed vol 1, vol 2 and vol 3.
Python
1.How To Get Data From Google Drive Into Colab
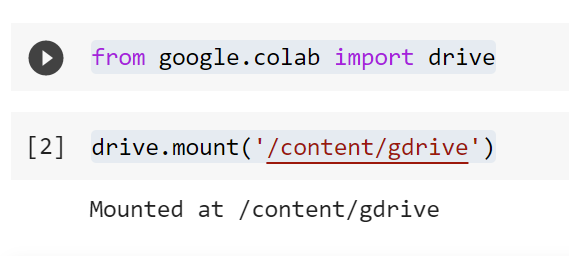
The Google Colab is becoming more and more popular in Data Science community. Working with Colab Jupyter notebooks, you are able to mount your Google Drive, so that to be able to get data from it directly. Let’s see how we can do it. You should open you notebook and to type the following commands:
It will send you a link to authorize your Google Drive by entering a token and you are done. Then you will see a folder called gdrive under your files:
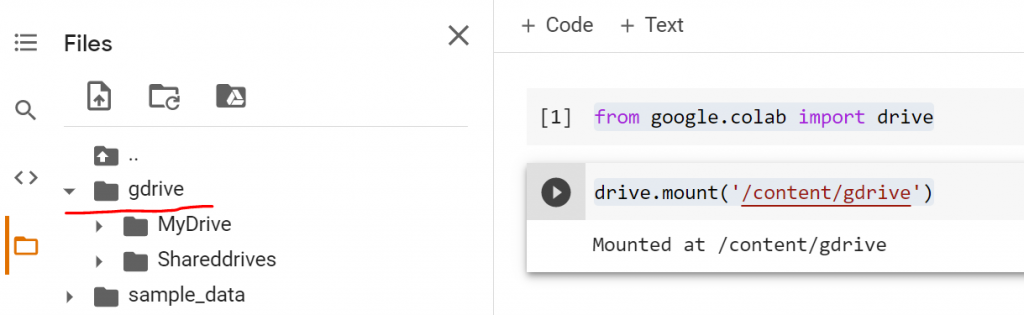
Now, if you want to get the exact path of the file, you can just right click and choose, Copy path which usually starts with /content/gdrive/MyDrive/
2.How to Impute Missing Values In Pandas
We will provide an example of how you can impute missing values in Pandas following the rules below:
- If the variable is numeric then impute the missing values with the mean
- If the variable is
objectdtypethen impute the missing values with the mode
import pandas as pd
import numpy as np

df = pd.DataFrame({'id':list(range(10)),
                   'A':[10,9,8,7,np.nan,np.nan,20,15,12,np.nan],
                   'B':["A","B","A","A",np.nan,"B","A","B",np.nan,"A"],
                   'C':[np.nan,"BB","CC","BB","BB","CC","AA","BB",np.nan,"AA"],
                   'D':[np.nan,20,18,22,18,17,19,np.nan,17,23]})
df

for i in df.columns:
    if (df[i].dtype=='object'):
        df[i].fillna(df[i].mode()[0], inplace=True)
    elif (df[i].dtype=='float64' or df[i].dtype=='int64'):
        df[i].fillna(df[i].mean(), inplace=True)

df

3.How To Read and Write Gzip/Zip Files with Pandas
We can write pandas data frames as gzip and zip files. For example:
#lets use this sample dataframe
df=pd.DataFrame({'A':[1,2,3,4]})
Save it as gzip or zip
# save it as gzip
df.to_csv("dataframe.csv.gz", index=False, compression="gzip")

# save it as gzip
df.to_csv("dataframe.csv.zip", index=False, compression="zip")
Read gzip/zip files Pandas
Pandas can also read gzip/zip files that contain a CSV.
pd.read_csv('dataframe.csv.gz')
   A
0  1
1  2
2  3
3  4
4.How To Read And Write CSV Files Without Headers With Pandas
Read Without Headers
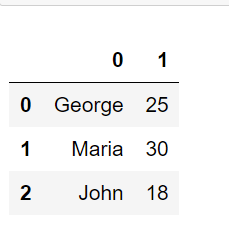
Assume that you have the following CSV file which is without column names. Let’s see how we can read it with pandas. Assume that my_file.csv is:
George,25
Maria,30
John,18
We can read the file as follows:
import pandas as pd
df = pd.read_csv("my_file.csv", header=None)
df
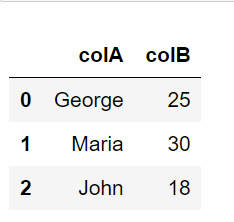
In case we want to give specific names to our column names:
df1 = pd.read_csv("my_file.csv", header=None, names=['colA', 'colB'])
df1
Write Without Headers
Now, let’s say that we want to write this dataframe to a csv file but without headers.
df.to_csv('filename.csv', header=False, index=False)
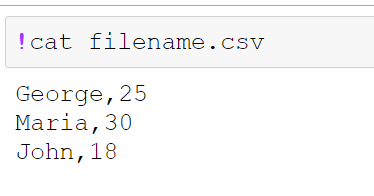
As we can see the filname.csv is without headers!
5.Cumulative Count Distinct Values in Python
Sometimes there is a need to do a rolling count of the distinct values of a list/vector. In other words, we want to add up only any new element that appears in our list/vector.
import pandas as pd

df = pd.DataFrame({'mylist':["e", "a","a","b","a","b","c", "d", "e"]})
df['CumDistinct'] = (~df.mylist.duplicated()).cumsum()
df

# or by using apply
# df['CumDistinct'] = df.mylist.apply(lambda x: (~pd.Series(x).duplicated()).cumsum())
Output:
  mylist  CumDistinct
0      e            1
1      a            2
2      a            2
3      b            3
4      a            3
5      b            3
6      c            4
7      d            5
8      e            5
6.Count The Consecutive Events In Python
We are going to represent a straightforward practical example of how to count consecutive events:
import pandas as pd
df = pd.DataFrame({'Score':['win', 'loss', 'loss', 'loss', 'win', 'win', 'win', 'win', 'win', 'loss', 'win', 'loss', 'loss']})
With the following “hack” we are going to get the column of the “Streak”:
df['Streak'] = df['Score'].groupby((df['Score'] != df['Score'].shift()).cumsum()).cumcount() + 1
df
Output:
   Score  Streak
0    win       1
1   loss       1
2   loss       2
3   loss       3
4    win       1
5    win       2
6    win       3
7    win       4
8    win       5
9   loss       1
10   win       1
11  loss       1
12  loss       2
R
7.Cumulative Count Distinct Values in R
Sometimes there is a need to do a rolling count of the distinct values of a list/vector. In other words, we want to add up only any new element that appears in our list/vector.
# assume that this is our vector
x=c("e", "a","a","b","a","b","c", "d", "e")

# we apply the "cumsum(!duplicated(x))" command
data.frame(Vector=x,
CumDistinct=cumsum(!duplicated(x)))
Output:
  Vector CumDistinct
1      e           1
2      a           2
3      a           2
4      b           3
5      a           3
6      b           3
7      c           4
8      d           5
9      e           5
8.Count The Consecutive Events In R
Assume that there is a Roulette Wheel which returns Red (50%) and Black (50%). We are going to simulate N=1,000,000 Rolls and keep track of the streaks of Red and Black respectively. The R function which makes our life easier is the rle but if we want to track the running streak, then we need also to use the seq function. We add also another column, called EndOfStreak which indicates if the Streak has ended or not.
library(tidyverse)

# number of simulations
n<-1000000

# set a random seed for reproducibility
set.seed(5)

# create the data frame
df<-tibble(Rolls=seq(1:n), Outcome=sample(c("Red", "Black"),n,replace = TRUE, prob = c(0.5,0.5)))%>%
  mutate(Streak=sequence(rle(Outcome)$lengths), EndOfStreak=ifelse(lead(Outcome)==Outcome, "No", "Yes"))

df%>%print(n=20)
Output:
# A tibble: 1,000,000 x 4
   Rolls Outcome Streak EndOfStreak
   <int> <chr>    <int> <chr>
 1     1 Black        1 Yes
 2     2 Red          1 No
 3     3 Red          2 Yes
 4     4 Black        1 No
 5     5 Black        2 Yes
 6     6 Red          1 No
 7     7 Red          2 No
 8     8 Red          3 No
 9     9 Red          4 Yes
10    10 Black        1 No
11    11 Black        2 No
12    12 Black        3 No
13    13 Black        4 Yes
14    14 Red          1 Yes
15    15 Black        1 No
16    16 Black        2 No
17    17 Black        3 Yes
18    18 Red          1 No
19    19 Red          2 No
20    20 Red          3 No
9.Replace Missing Values With The Mean Value
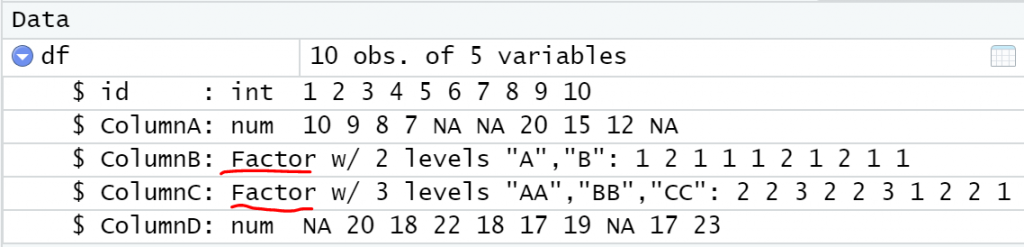
Assume that you are dealing with a Data Frame with missing values, and you want to replace them with the mean value of the corresponding column. Let’s consider the following Data Frame:
df<-data.frame(id=seq(1,10), ColumnA=c(10,9,8,7,NA,NA,20,15,12,NA),
           ColumnB=factor(c("A","B","A","A","","B","A","B","","A")),
           ColumnC=factor(c("","BB","CC","BB","BB","CC","AA","BB","","AA")),
           ColumnD=c(NA,20,18,22,18,17,19,NA,17,23)
)

df

Clearly, we want to consider only the numeric variables. Let’s see how we can do it in one-line code.
df[sapply(df, is.numeric)] <- lapply(df[sapply(df, is.numeric)], function(x) ifelse(is.na(x), mean(x, na.rm = TRUE), x))
df

10.Replace Categorical Variables With Mode
In Data Science project, it is common to replace the missing values of the categorical variables with the mode. Let’s see the following example:
df<-data.frame(id=seq(1,10), ColumnA=c(10,9,8,7,NA,NA,20,15,12,NA),
           ColumnB=c("A","B","A","A","","B","A","B","","A"),
           ColumnC=c("","BB","CC","BB","BB","CC","AA","BB","","AA"),
           ColumnD=c(NA,20,18,22,18,17,19,NA,17,23)
)

df
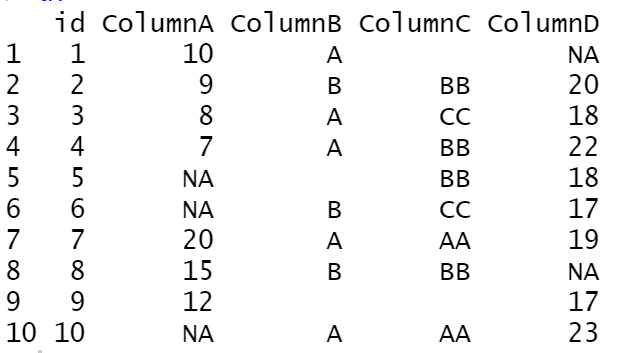
Note that the ColumnB and ColumnC are Character columns. Note also that there is no mode function in R. So let’s build it:
getmode <- function(v){
  v=v[nchar(as.character(v))>0]
  uniqv <- unique(v)
  uniqv[which.max(tabulate(match(v, uniqv)))]
}
Now let’s replace all the empty strings of the Character variables with their corresponding column mode. Finally, we should convert the character variables to factors.
df[sapply(df, is.character)] <- lapply(df[sapply(df, is.character)], function(x) ifelse(x=="", getmode(x), x))
df[sapply(df, is.character)] <- lapply(df[sapply(df, is.character)], as.factor)
df
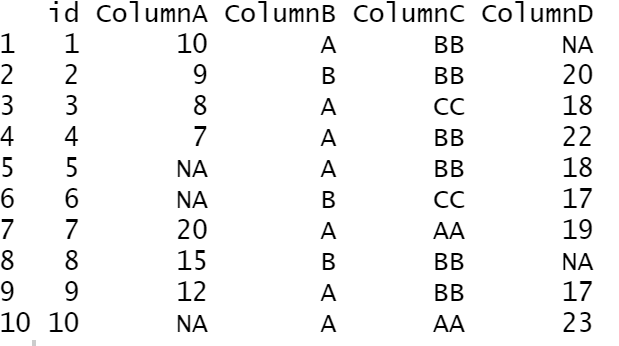
As we can see, we replaced the empty strings with the corresponding mode.


