

We have started a series of articles on tips and tricks for data scientists (mainly in Python and R). In case you have missed:
R
1.How To Remove The Correlated Variables From A Data Frame
When we build predictive models, we use to remove the high correlated variables (multi-collinearity). The point is to keep on of the two correlated variables. Let’s see how we can do it in R by taking as an example the independent variables of the iris dataset.
Get the correlation matrix of the IVs of iris dataset:
df<-iris[, c(1:4)]

cor(df)
Output:
             Sepal.Length Sepal.Width Petal.Length Petal.Width
Sepal.Length    1.0000000  -0.1175698    0.8717538   0.8179411
Sepal.Width    -0.1175698   1.0000000   -0.4284401  -0.3661259
Petal.Length    0.8717538  -0.4284401    1.0000000   0.9628654
Petal.Width     0.8179411  -0.3661259    0.9628654   1.0000000
As we can see there are some variables that are highly correlated. Let’s say that we want to remove all the variables which have an absolute correlation greater than a threshold, let’s say 80% in our case. First, we need to get the correlation of each pair but counting each pair once.
Var1<-NULL
Var2<-NULL
Correlation<-NULL

for (i in 1:ncol(df)) {
  for (j in 1:ncol(df)) {
    if (i>j) {
      Var1<-c(Var1,names(df)[i])
      Var2<-c(Var2,names(df)[j])
      Correlation<-c(Correlation, cor(df[,i], df[,j]))

    }
  }
}

output<-data.frame(Var1=Var1, Var2=Var2, Correlation=Correlation)
output
Output:
          Var1         Var2 Correlation
1  Sepal.Width Sepal.Length  -0.1175698
2 Petal.Length Sepal.Length   0.8717538
3 Petal.Length  Sepal.Width  -0.4284401
4  Petal.Width Sepal.Length   0.8179411
5  Petal.Width  Sepal.Width  -0.3661259
6  Petal.Width Petal.Length   0.9628654
Let’s remove one of the two variables for each pair which has an absolute correlation greater than 80%.
threshold<-0.8

exclude<-unique(output[abs(output$Correlation)>=threshold,'Var2'])

reduced<-df[, !names(df)%in%exclude]

head(reduced)
Output:
  Sepal.Width Petal.Width
1         3.5         0.2
2         3.0         0.2
3         3.2         0.2
4         3.1         0.2
5         3.6         0.2
6         3.9         0.4
Let’s also get the correlation of the reduced data frame.
cor(reduced)
Output:
          Sepal.Width Petal.Width
Sepal.Width   1.0000000  -0.3661259
Petal.Width  -0.3661259   1.0000000
As we can see we removed the correlated variables and we left with 2 IVs instead of 4.
2.How to Update All R Packages
You can update the R packages as follows:
# list all packages that you can update
old.packages()

# update all packages
update.packages()

# update, without prompts
update.packages(ask = FALSE)

# update only a specific package
install.packages("dplyr")
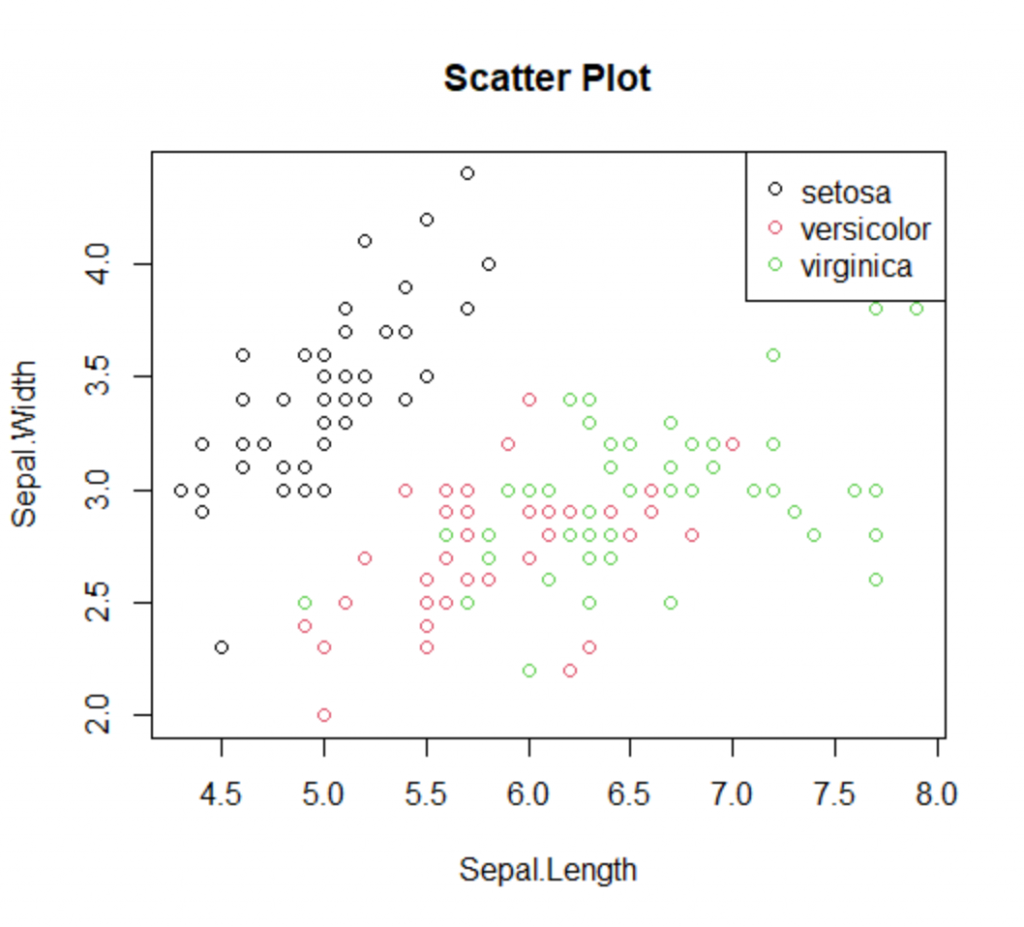
3.How To Add Class Colors And Legend To Scatterplots
Assume that you want to create a scatter plot and to add a color based on the class and finally to add a label/legend to the chart showing the mapping of the colors and classes. Let’s see how we can do it with the base package.
plot(iris$Sepal.Length, iris$Sepal.Width, col=iris$Species, main="Scatter Plot" , xlab="Sepal.Length", ylab="Sepal.Width")
legend(x="topright", legend=levels(iris$Species), col=unique(as.numeric((iris$Species))), pch=1)
Python
4.How To Apply A Rolling Weighted Moving Average In Pandas
Pandas has built-in functions for rolling windows that enable us to get the moving average or even an exponential moving average. However, if we want to set custom weights to our observations there is not any built-in function. Below we provide an example of how we can apply a weighted moving average with a rolling window.
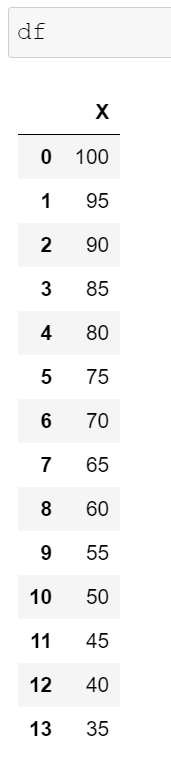
Assume that we have the following data frame and we want to get a moving average with a rolling window of 4 observations where the most recent observations will have more weight than the older ones.
import pandas as pd
import numpy as np

df = pd.DataFrame({'X':range(100,30, -5)})
We need to define the weights and to make sure that they add up to 1. Our weights can be [0.1, 0.2, 0.3, 0.4].
weights = np.array([0.1, 0.2, 0.3, 0.4])
df['MA'] = df['X'].rolling(4).apply(lambda x: np.sum(weights*x))
df

Note that the first three observations are NaN since our rolling window was set to 4. The 4th observation (index=3), is equal to 90 since 100*0.1 + 95*0.2 + 90*0.3 + 85*0.4=90
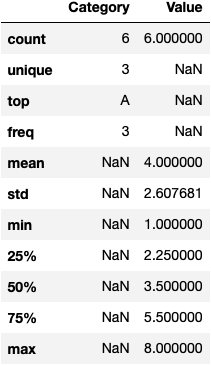
5.How To Describe Columns With Categorical Values In Pandas
By default in Pandas when you are using the describe function, it returns only the numeric columns. However, using the following “hack” pandas returns all columns including the categorical.
df=pd.DataFrame({"Category":['A','A','B','C','B','A'],
                  'Value':[4,2,6,3,8,1]})

df.describe(include='all')
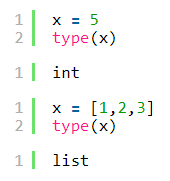
6.How To Check The Data Type In An If Statement
In Python we can get the data types of an object with the type command (type(object)). For example:
However, this approach does not work in the if statements as we can see below:
x = [1,2,3]
if type(x)=='list':
    print("This is a list")

else:
    print("I didn't find any list")
I didn't find any list
For that reason, we should work with the isinstance(object, type) function. For example:
x = [1,2,3]
if isinstance(x, list):
    print("This is a list")

elif isinstance(x, int):
    print("This is an integer")

else:
    print("This is neither list nor integer")
This is a list
x = 5
if isinstance(x, list):
    print("This is a list")

elif isinstance(x, int):
    print("This is an integer")

else:
    print("This is neither list nor integer")
This is an integer
x = "5"
if isinstance(x, list):
    print("This is a list")

elif isinstance(x, int):
    print("This is an integer")

else:
    print("This is neither list nor integer")
This is neither list nor integer


