
We have provided an example of how to Build and Deploy a Machine Learning Web App using Python and Flask. In this tutorial, we will show how you can share your models with your clients and/or colleagues using Shiny.
The Scenario
Assume that you have built a Machine Learning model and you other people to be able to interact with it. So, let’s say that you want to build a tool that takes as an input a CSV file of the data that you want to get predictions and the output will be the predicted values.
Build the Model
For exhibition purposes, we will work with the iris dataset by building a multinomial logistic regression model. Once we build the model, we will save it and we will use it later.
library(nnet)

irisModel<-multinom(Species~Sepal.Length+Sepal.Width+Petal.Length+Petal.Width,data = iris)

saveRDS(irisModel, "irisModel.rds")
So, we built the logistic regression model and we saved it as “irisModel.rds”.
Build the Shiny App
The Shiny App will do the following things:
- Load the
irisModel.rdsmodel - Ask the users to upload a csv file of the data that they want to predict
- Run the predictions on the data
- Return the predictions on the UI and give them the opportunity to download them in a csv format.
On purpose, the Shiny App will be as simple as possible. In another post, we will provide tutorials of how you can build advanced Shiny Apps.
For now, we can open the R Studio, File–>New File–>Shiny Web App. Then, you should choose a name for your Shiny Web App and it will create a folder and a sample code file. Within the folder, store the irisModel.rds object. The code is the following:
library(shiny)
library(nnet)
library(DT)
library(tidyverse)
irisModel <- readRDS("irisModel.rds")
# Define UI for application that draws a histogram
ui <- fluidPage(
# Application title
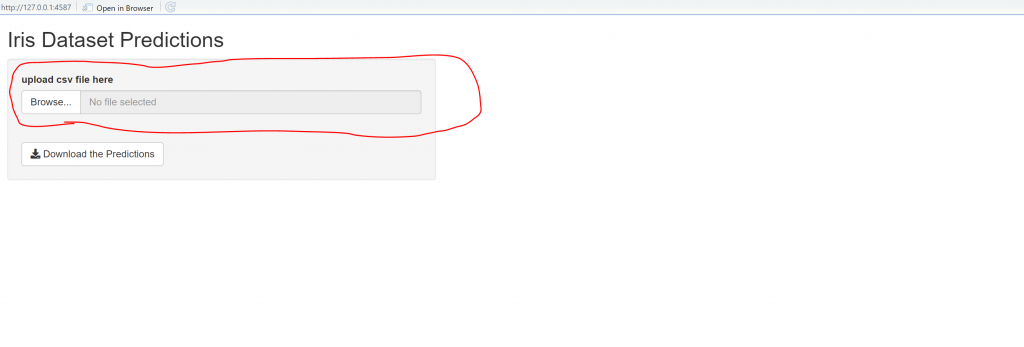
titlePanel("Iris Dataset Predictions"),
# Sidebar with a slider input for number of bins
sidebarLayout(
sidebarPanel(
# Input: Select a file ----
fileInput("file1", "upload csv file here",
multiple = FALSE,
accept = c("text/csv",
"text/comma-separated-values,text/plain",
".csv")),
# Button
downloadButton("downloadData", "Download the Predictions")
),
# Show the table with the predictions
mainPanel(
DT::dataTableOutput("mytable")
)
)
)
# Define server logic required to draw a histogram
server <- function(input, output) {
reactiveDF<-reactive({
req(input$file1)
df <- read.csv(input$file1$datapath, stringsAsFactors = TRUE)
df$predictions<-predict(irisModel, newdata = df, type ="class")
return(df)
})
output$mytable = DT::renderDataTable({
req(input$file1)
return(DT::datatable(reactiveDF(), options = list(pageLength = 100), filter = c("top")))
})
# Downloadable csv of selected dataset ----
output$downloadData <- downloadHandler(
filename = function() {
paste("data-", Sys.Date(), ".csv", sep="")
},
content = function(file) {
write.csv(reactiveDF(), file, row.names = FALSE)
}
)
}
# Run the application
shinyApp(ui = ui, server = server)
Explanation of the Code
ui
Within the sidebarLayout we have the sidebarPanel and the mainPanel. Let’s have a closer look at these parts:
sidebarPanel
We have the fileInput that allows us to upload a CSV file and the downloadButton which is the button to download the predictions.
mainPanel
In the main panel we return in the UI the predictions as a DT table.
sever
We have the reactiveDF which is a reactive object and starts working once there is an input file, that is why we used the command req(input$file1). Then we read the CSV file and we add the predictions in an extra column. Then we have to return this reactive object and that is why we created the output$mytable, Notice that the mytable was defined in the UI part. Finally, we define the output$downloadData object which downloads the reactiveDF once we press the downloadButton. Notice that we the downloadData was defined in the UI part.
Get the Predictions
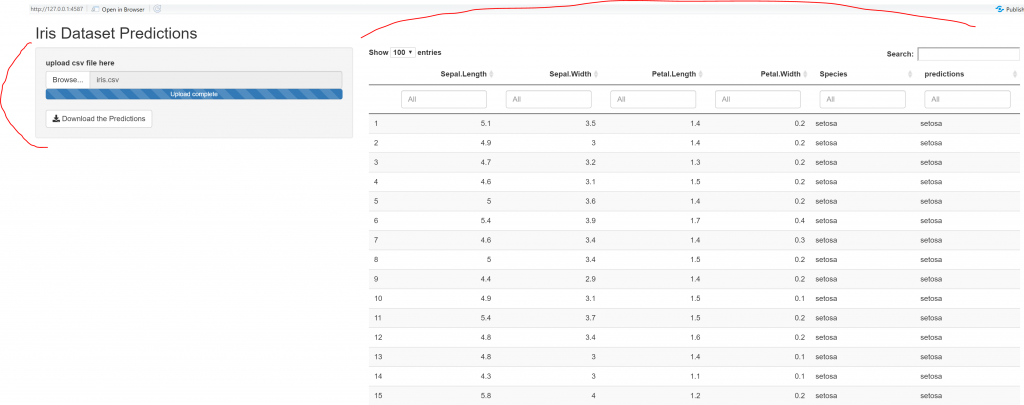
I will upload the iris.csv. Notice that this file contains already the species. It does not matter since our model gets as input only the features and its adds an extra column for the predictions. So, it will help us to see if it returns right predictions.
Once we upload the file we get the predictions:
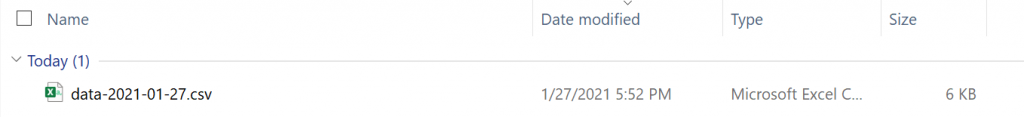
And if we click on the Download the Predictions button we get the predictions in a csv file.
Deployment
This Shiny App can be deployed to ShinyApps.io or if you have a server, you can run the R Studio on it. Using AWS is relatively easy to run R Studio as described here.
The Takeaways
As a Data Scientist or Data Analyst, it is import to be able to share your tools externally and interactively. Shiny is a great tool for this type of tasks since it does not require you to know HTML, CSS etc.


6 thoughts on “How to Share your Machine Learning Models with Shiny”
Hi, George, thanks for sharing…
But it seems that we should use the uploaded file (df) for predictions, instead iris dataset itself.
Am I missing something?
Thank you Carlos, you are absolutely right. My bad! I updated it
Hi,
I tried this code it works fine on my local computer
I tried to deploy this app on shiny it gives error due to rds file “abc.rds not found in the directory”
could you help me out with this
via brief zoom call etc?
[email protected]
Its resolved.
Thanks
You can delete the comment. 🙂
Hello,
This is a great intro to deploying R models with Shiny. Unfortunately, it didn’t work for me either when I deployed the app to shinyapps.io. It worked locally, but when I tried to run it on shinyapps.io I got this error: “Warning: Error in UseMethod: no applicable method for ‘predict’ applied to an object of class “c(‘multinom’…”. It was resolved by adding “library(nnet)” to the ui.R script.
Thank you for this great tutorial. Would it be possible to let the users enter the predictors directly instead of uploading a csv (similar to https://www.r-bloggers.com/2017/04/generating-dynamic-nomograms-using-dynnom/)?