
Sometimes we need to generate correlated data for exhibition purposes, technical assessments, testing etc. We have provided a walk-through example of how to generate correlated data in Python using the scikit-learn library. In R, as far as I know, there is not any library that allows us to generate correlated data. For that reason, we will work with the simulated data from the Multivariate Normal Distribution. I would suggest having a look at the variance-covariance matrix and the relationship between correlation and covariance.
Generate Correlated Data
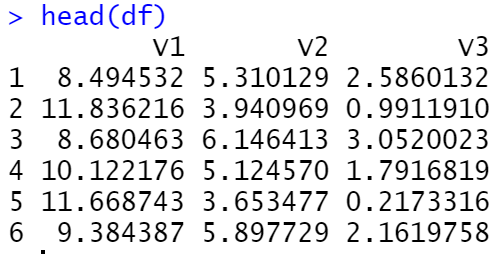
We will generate 1000 observations from the Multivariate Normal Distribution of 3 Gaussians as follows:
- V1~N(10,1), V2~N(5,1), V3~N(2,1)
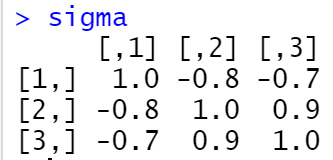
- The correlation of V1 vs V2 is around -0.8, the correlation of V1 vs V2 is around -0.7 and the correlation of V2 vs V3 is around 0.9
library(MASS)
library(tidyverse)
library(GGally)


set.seed(5)

# create the variance covariance matrix
sigma<-rbind(c(1,-0.8,-0.7), c(-0.8,1, 0.9), c(-0.7,0.9,1))

# create the mean vector
mu<-c(10, 5, 2)

# generate the multivariate normal distribution
df<-as.data.frame(mvrnorm(n=1000, mu=mu, Sigma=sigma))

ggpairs(df)
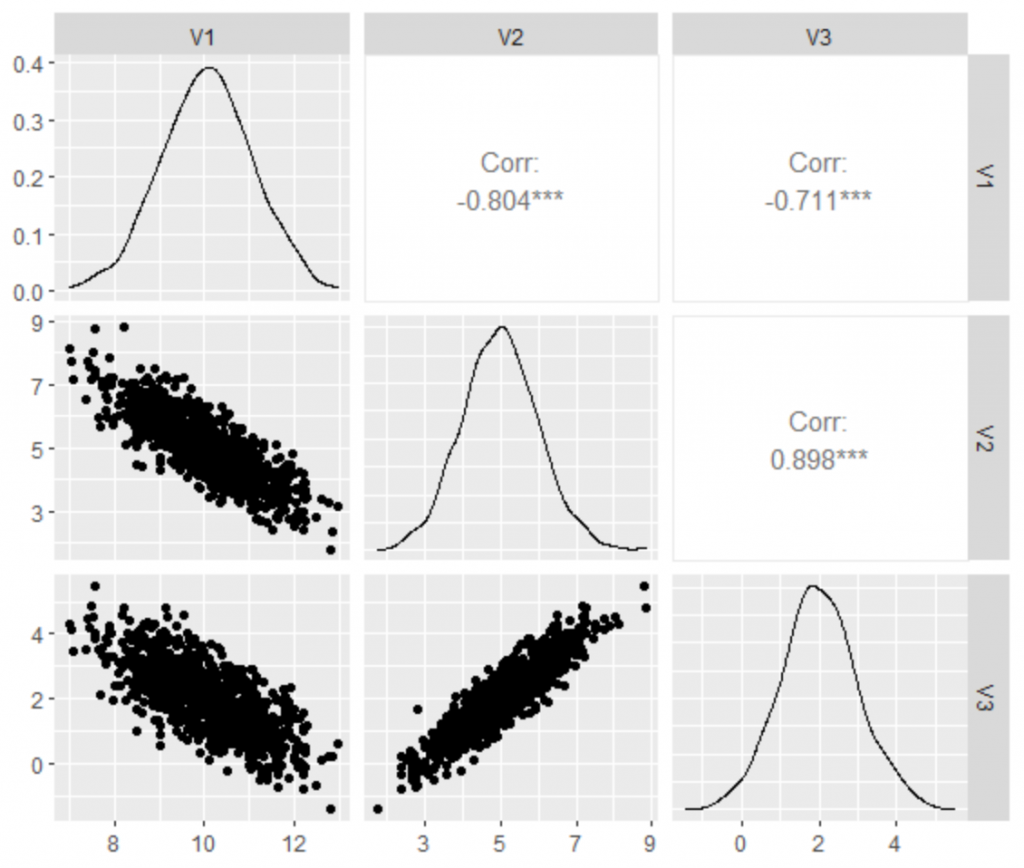
As we can see, we generated the correlated data with the expected outcome in terms of mean, variance, and correlation.
Generate Categorical Correlated Data
In the case where we want to generate categorical data, we work in two steps. First, we generate the continuous correlated data as we did above, and then we transform it to categorical by creating bins.
Binary Variables
Let’s see how we can create a Binary variable taking values 0 and 1:
df<-df%>%mutate(MyBinary = ifelse(V1>median(V1), 1 ,0))
Binary Variables with Noise
In the above example, we set the value “1” when the V1 variable is greater than the median and “0” otherwise. Let’s say that we want to create more noise data, i.e. not fully correlated. Let’s say that we want to apply the following rule:
- If the variable is greater than the median, then assign 1 with a 75% probability
- If the variable is less than the median, then assign 1 with a 25% probability
df<-df%>%mutate(MyNoisyBinary = ifelse(V1>median(V1), sample(c(0,1),n(), replace = TRUE, p=c(0.25, 0.75)) ,
                                       sample(c(0,1),n(), replace = TRUE, p=c(0.75, 0.25))))
Categorical Variables
Similarly, we can generate categorical variables of many levels. Let’s say that we want to create the age group from V1 with the following rules:
- If it is less than the Q1 then Age Group 1
- If it is less than the Q2 then Age Group 2
- if it is less than the Q3 then Age Group 3
- else, Age Group 4
df<-df%>%mutate(AgeGroup= case_when(V1<quantile(V1,0.25)~"Group 1",
                                V1<quantile(V1,0.5)~"Group 2",
                                V1<quantile(V1,0.75)~"Group 3",
                                TRUE~"Group 4"))
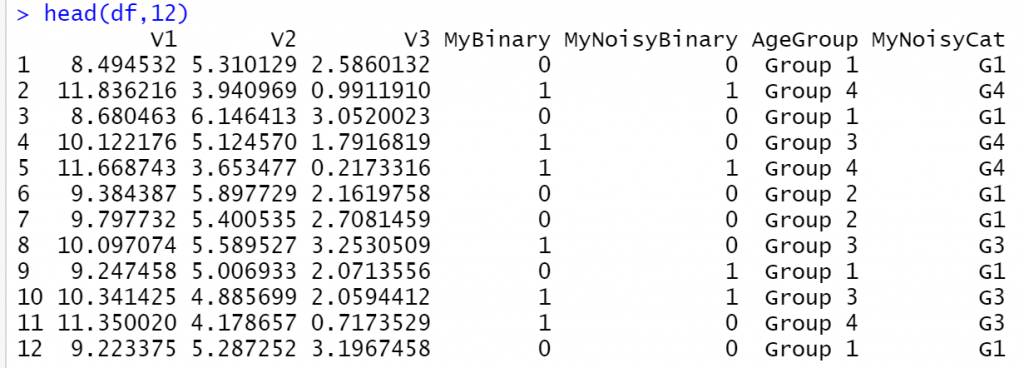
Categorical Variables with Noise
Similarly, we can add some noise to our generated categorical variables as follows:
df<-df%>%mutate(MyNoisyCat= case_when(V1<quantile(V1,0.25)~sample(c("G1","G2","G3","G4"),n(), replace = TRUE, p=c(0.70, 0.1, 0.1, 0.1)),
V1<quantile(V1,0.5)~sample(c("G1","G2","G3","G4"),n(), replace = TRUE, p=c(0.1, 0.7, 0.1, 0.1)),
V1<quantile(V1,0.75)~sample(c("G1","G2","G3","G4"),n(), replace = TRUE, p=c(0.1, 0.1, 0.7, 0.1)),
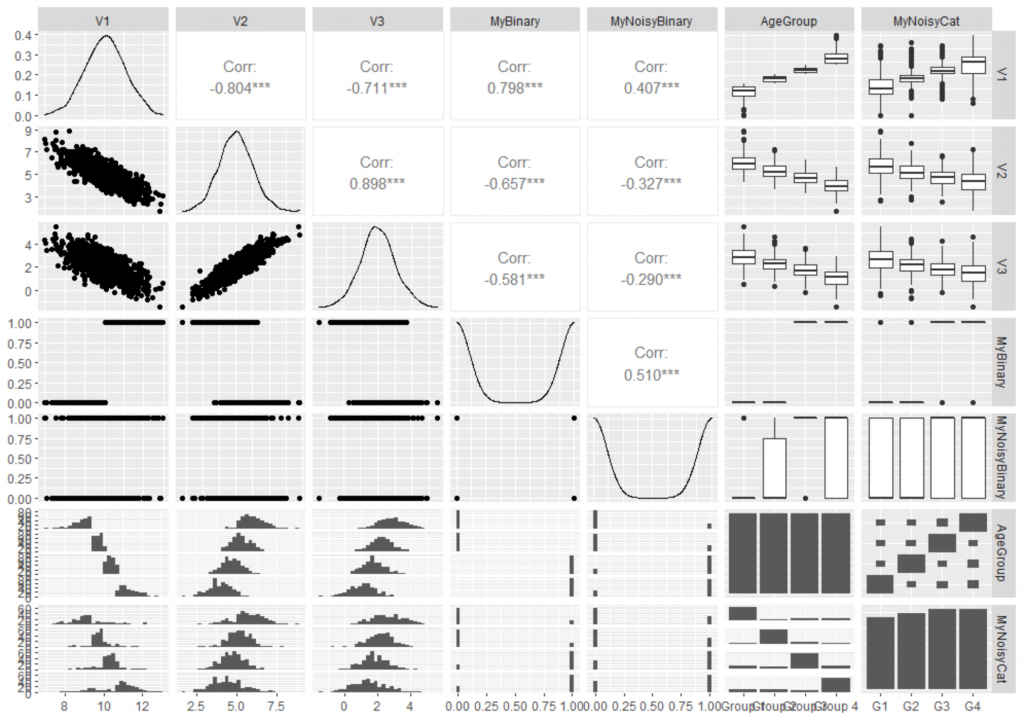
TRUE~sample(c("G1","G2","G3","G4"),n(), replace = TRUE, p=c(0.1, 0.1, 0.1, 0.7))))
ggpairs(df)


1 thought on “How to Generate Correlated Data in R”
Granted there is a package mvnorm which you can use to generate correlated normal variates. This post would be vastly more instructive if it included a block, with explanation, how to do this by hand using only the univariate functions and the correlation matrix
set.seed(5)
# create the mean vector
mu<-c(10, 5, 2)
# create the variance covariance matrix
sigma<-rbind(c(1,-0.8,-0.7), c(-0.8,1, 0.9), c(-0.7,0.9,1))
# Generate 3 independent stadard normals
V <- matrix(rnorm(3*1000), 1000,3)
# correlate them and give them the desired means
V <- t(t(V %*% chol(sigma)) + mu)