

In this tutorial, we will show you how to apply the Benjamini-Hochberg procedure in order to calculate the False Discovery Rate (FDR) and the P-Value Adjusted.
The Benjamini-Hochberg procedure, also known as the False Discovery Rate (FDR) procedure, is a statistical method used in multiple hypothesis testing to control the expected proportion of false discoveries. In many scientific studies or experiments, researchers test multiple hypotheses simultaneously, but when multiple tests are performed, the probability of obtaining at least one false positive result increases leading to an increased overall Type I error rate.
The Benjamini-Hochberg procedure addresses this issue by controlling the FDR, which is defined as the expected proportion of false positives among the rejected hypotheses.
The calculation of adjusted p-values in the Benjamini-Hochberg procedure involves comparing each individual p-value to a critical value or threshold. The critical value is determined based on the desired false discovery rate (FDR) control.
Here are the steps involved in calculating adjusted p-values using the Benjamini-Hochberg procedure:
- Sort the p-values in ascending order.
- Assign a rank or position (denoted as “i”) to each p-value based on its position in the sorted list.
- Calculate the adjusted p-value for each p-value using the formula: Adjusted p-value \(p_{(i)}^{adjusted} = min\{1, min_{j\geq i}\{ \frac{mp_{(j)}}{j}\} \}\) where:
- \(p_{(i)}^{adjusted}\) represents the adjusted p-value for the i-th ranked p-value.
- \(p_{(j)}\) represents the j-th ranked p-value.
- m represents the total number of hypotheses being tested. In this formula, for each p-value at rank i, the adjusted p-value is calculated as the minimum value between 1 and the minimum ratio obtained by dividing m (the total number of hypotheses) by j (the rank) for all j greater than or equal to i. The purpose of taking the minimum ratio is to find the smallest value that controls the FDR while considering all hypotheses ranked at or above the current p-value. Taking the minimum ensures that the adjusted p-value is conservative, accounting for the multiple-testing scenario.
- Report the adjusted p-values alongside the original p-values. The adjusted p-values provide a corrected measure of statistical significance that accounts for multiple testing.
By comparing the p-values to their adjusted counterparts, researchers can identify the hypotheses that remain statistically significant after adjusting for multiple testing. This helps control the FDR and provides a more conservative approach to hypothesis testing when conducting multiple comparisons simultaneously.
It’s worth noting that the Benjamini-Hochberg procedure assumes that the null hypotheses are independent or exhibit positive dependency. If the null hypotheses are highly dependent, alternative procedures like the Benjamini-Yekutieli procedure can be used to provide stronger control over the FDR.
Apply the Benjamini-Hochberg Procedure from Scratch
Let’s see how we can calculate the P-Value Adjusted from scratch using R. For this example, we will consider the following 6 P-Values and we will apply the Benjamini-Hochberg Procedure to calculate the P-Value Adjusted:
0.01,0.001, 0.05, 0.20, 0.15, 0.15
Let’s start coding!
pvalues<-c(0.01,0.001, 0.05, 0.20, 0.15, 0.15)


ranks<-rank(pvalues, ties.method = "last")

p_m_over_k<-pvalues*length(pvalues)/ranks


for (r in length(pvalues):1) {
  print(p_m_over_k[ranks>=r])
}


pvalues_adj<-c()

for (i in 1:length(pvalues)) {

  # find the rank
  tmp_rank<-ranks[i]

  # get all the p_m_over_k that are greater or equal to this rank
  # and get the min value
  pvalues_adj<-c(pvalues_adj, min(1,min(p_m_over_k[ranks>=tmp_rank])))
}

print(pvalues_adj)
[1] 0.030 0.006 0.100 0.200 0.180 0.180Get the P-Value Adjusted using the R Built-in Function
R makes our life easier by having a built-in function for calculating the P-Value Adjusted. Let’s try it.
fdrs<-p.adjust(pvalues, method="BH")

print(fdrs)
[1] 0.030 0.006 0.100 0.200 0.180 0.180As we can see, we got the same results. Let’s confirm it by running the equal command:
all.equal(fdrs,pvalues_adj)
[1] TRUEGet the P-Value Adjusted in Python
We can apply the FDR and get the P-Value Adjusted in Python using the SciPy library, but we need to use at least the version 1.11.
import scipy
print(scipy.__version__)
'1.11.1'from scipy import stats pvalues = [0.01,0.001, 0.05, 0.20, 0.15, 0.15] print(stats.false_discovery_control(pvalues))
array([0.03 , 0.006, 0.1 , 0.2 , 0.18 , 0.18 ])As we can see, we got the same results as before.
Get the P-Value Adjusted in Excel/Google Spreadsheet
Since the majority of people use spreadsheets, let’s see how we can apply the procedure there.
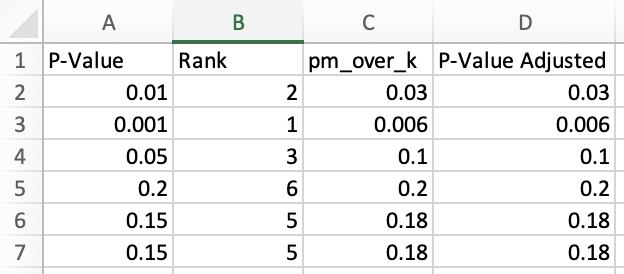
First, we have to add manually the P-Values, in our case this is the P-Value column. Then, we have to calculate the Ranks. Note, that we should do a hack because Excel’s rank function assigns the same value to the ties, but we want to assign the highest rank to the value that appears first.
So, the Excel formula for column B which is the Rank column is:
=RANK.EQ(A2,$A$2:$A$7,1)+COUNTIF($A$2:$A$7,A2)-1Then, for column C which is the P times m divided by k, the formula is:
=A2*COUNT($A$2:$A$7)/B2Finally, for column D, the formula is:
=MIN(1,MINIFS($C$2:$C$7,$B$2:$B$7,">="&B2))The only thing that you have to do is to drag the cell formulas and you will get the full table that we showed above. As you can see, we got the same P-Values Adjusted with R and Python!


