

In the cryptocurrency market, the big whales play a key role. These movements affect significantly the market. Take for example a well-known big whale, Elon Musk. Whenever he trades a big amount of Bitcoins, the market follows him. In this post, we will try to build an algorithmic trading strategy that takes an advantage of big whales’ movements.
The Scenario
We can detect the whales from the per-minute volume. When there is a significant spike in the volumes, it means that there is an anomaly and most probably is due to the trades of a big investor, the so-called “whale”. Usually, the market reacts to these transactions. Thus, if we are able to detect the minute of this anomaly and we open a position on time, we may make some profits.
The Trading Strategy
We will examine only long-positions, i.e. we will not apply any short-selling. Thus, we want to detect the per-minute spikes in “Volume Buy”. We will apply moving averages of one week for the “Volume Buy” and we will determine a spike when the “Volume Buy” is greater than the current moving average plus 15 times the standard deviation, these spikes are our trading signals. However, because when a spike occurs, then it is quite likely the next observation to be a spike too, we will open a position to the first spike occurrence within a 10-minute interval. For this example, we will work with the BTC per-minute data of 1 year period (May 2020 to May 2021). Once we open the position we will follow the trading strategy below:
Open your position (1$) when the spike occurs. and consider an observation window of 48 hours:
- If the price has raised more than 7%, then close your position (TF)
- If at least 12 hours have passed and the price is below 2% then close your position (SL)
- if nothing of the above cases occurred, close your position at the end of the observation window of 48 hours at the running price.
Finally, we will apply backtesting to evaluate the suggested trading strategy.
Coding
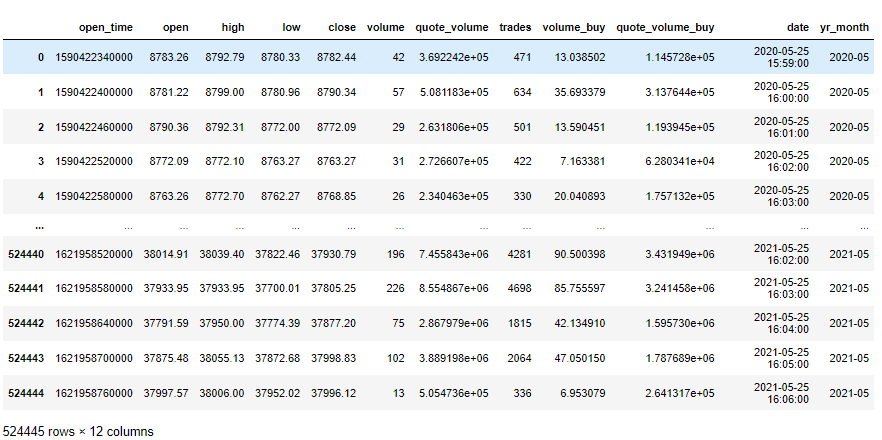
We will work with Python and you can follow along. The close time is in UNIX Timestamp and we will convert them to datetime object
import pandas as pd
import numpy as np
import matplotlib.pyplot as plt


# load the data
df = pd.read_csv("BTC_1m.csv")

df['date'] = pd.to_datetime(df['open_time'],unit='ms')
df['yr_month'] =  df['date'].dt.strftime("%Y-%m")
df
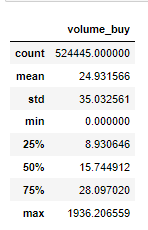
Get the summary statistics of the volume_buy column
df[['volume_buy']].describe()
df.boxplot(by='yr_month',column='volume_buy', figsize=(12,8))
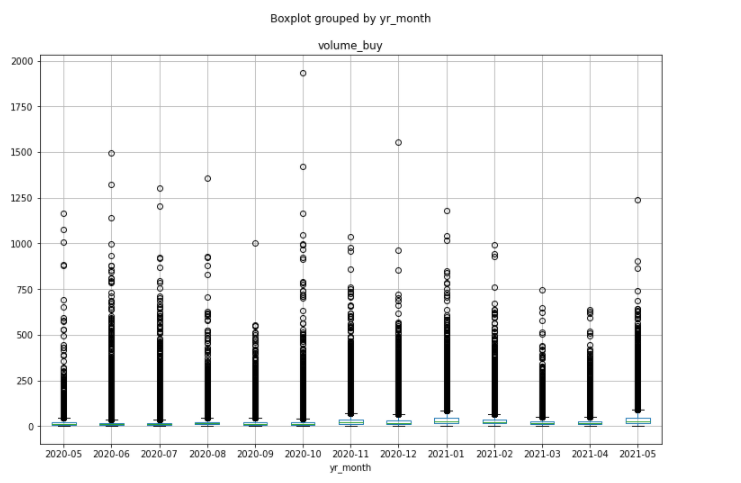
All these black circles on the top of the y-axis can be considered as spikes. Let’s try to detect the spikes dynamically with the rolling mean and standard deviation.
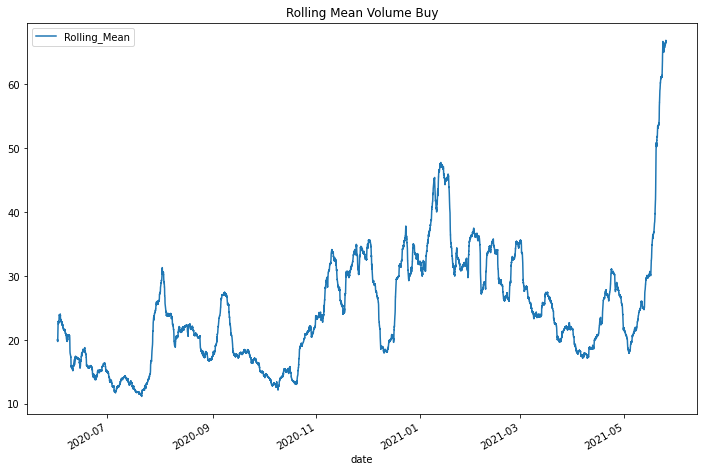
df['Rolling_Mean'] = df['volume_buy'].rolling(10080).mean()
df['Rolling_Std'] = df['volume_buy'].rolling(10080).std()

df.plot(figsize=(12,8), x='date', y='Rolling_Mean', title = 'Rolling Mean Volume Buy')
df.plot(figsize=(12,8), x='date', y='Rolling_Std', title = 'Rolling Std Volume Buy')

Define the Spikes
From the plots above, we can see that the distribution of volumes is not stable (as expected). We will define a “Spike” when there is a volume greater than the rolling mean + (15 x Std)
df['Spike'] = (df.volume_buy>(df.Rolling_Mean + (df.Rolling_Std*15)))
spike_df = df.loc[df.Spike==True]
spike_df

From the 500K observations, we detected 227 spikes.
See what happened 30 minutes before and 30 minutes after the Spike
cnt = 0
start_idx = 30
end_idx = 30
for s in spike_df.index:
    # check that there is no other spike within the last 10 minutes
    if df.iloc[(s-10):s+1].Spike.sum()==1:
        print(df.iloc[(s-1):(s+1)][['date','close', 'volume_buy']])
        plt.figure(figsize=(8,6))
        #df.iloc[(s-10):(s+2880)].close.plot()
        df.iloc[(s-start_idx):(s+end_idx)].plot(x='date', y='close', figsize=(12,8))
        plt.vlines(x=df.iloc[s].date, ymin=df.iloc[(s-start_idx):(s+end_idx)].close.min(), ymax=df.iloc[(s-start_idx):(s+end_idx)].close.max(), color='r', linestyle='-')
        plt.show()
        cnt+=1
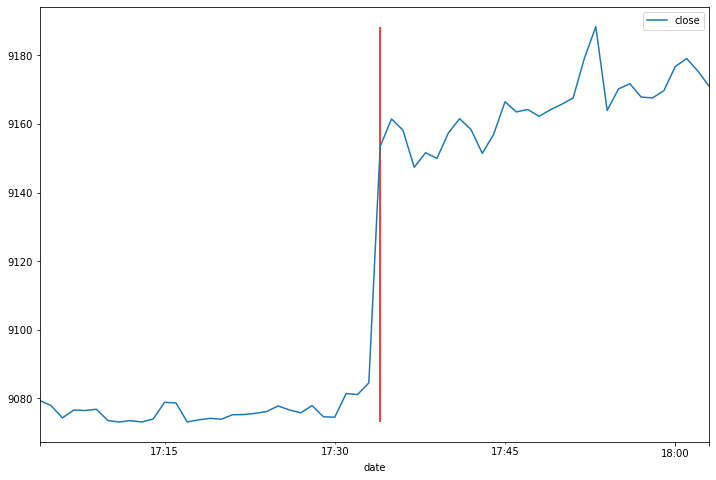
Some examples of the plots where the vertical red line is the time of Spike occurrence.
                     date    close   volume_buy
18605 2020-06-07 14:04:00  9451.00    21.444024
18606 2020-06-07 14:05:00  9437.54  1496.813867

                    date    close  volume_buy
60258 2020-07-06 15:47:00  9274.26   42.103849
60259 2020-07-06 15:48:00  9295.16  459.826953

                                           date    close  volume_buy
57484 2020-07-04 17:33:00  9084.53   24.271821
57485 2020-07-04 17:34:00  9153.50  545.610165
Back Testing
Let’s see how much we would have made by applying this trading strategy.
buy_time_lst = []
buy_price_lst = []
close_price_lst = []
close_time_lst = []

for s in spike_df.index:
    if df.iloc[(s-10):s+1].Spike.sum()==1:
        tmp = df.iloc[(s):(s+2880)]
        buy_time = tmp.loc[s,'date']
        buy_price = tmp.loc[s,'close']
        for i in range(len(tmp)):
            if (tmp.iloc[i]['close']/buy_price-1)>0.07:
                close_price = tmp.iloc[i]['close']
                close_time = tmp.iloc[i]['date']
                break
            elif ((i>1440) and ((tmp.iloc[i]['close']/buy_price-1)<-0.02)):
                close_price = tmp.iloc[i]['close']
                close_time = tmp.iloc[i]['date']
                break
            else:
                close_price = tmp.iloc[i]['close']
                close_time = tmp.iloc[i]['date']

        buy_time_lst.append(buy_time)
        buy_price_lst.append(buy_price)
        close_price_lst.append(close_price)
        close_time_lst.append(close_time)


PL = pd.DataFrame({'buy_time':buy_time_lst, 'buy_price':buy_price_lst,
                  'close_price':close_price_lst, 'close_time':close_time_lst})
PL['profit'] = PL['close_price']- PL['buy_price']
PL['pct_profit'] = (PL['close_price']/PL['buy_price']-1)
PL['Unit_Buy'] = 1
PL['Unit_Sell'] = 1*(1+PL['pct_profit'])

PL
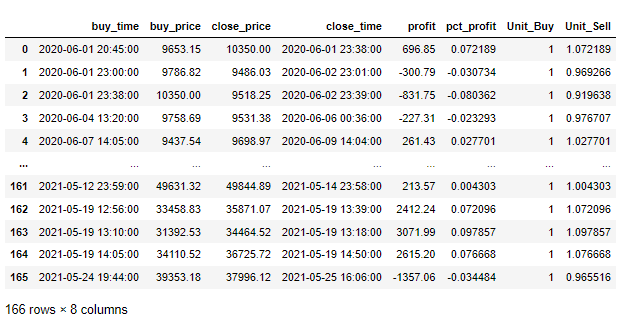
And the ROI of this trading strategy was 1.367%

The Takeaway
We opened 166 positions within 1 year and the ROI was around 1.37%, but if you take into consideration the transaction fees, the ROI is even lower. I think that this strategy could be a good starting point but needs to take into consideration other parameters too, like that there is no spike in the volume quote at the same time and there is no other spike in the other cryptos at the same time. Also, someone can play with the TF and SP thresholds, as well as the definition of the spikes (how many standard deviations, rolling mean average period etc).
Looking at the cryptocurrency market, by take is to chose one direction, long or short and to wait! You may make or lose money.
Get 25$ in BTC for FREE
You can get $25 in Bitcoin by investing $100 in Nexo


1 thought on “How to Fish the Bitcoin Whales”
Binance API