
Streamlit is a great library that helps us create python apps with minimum effort. Not only it’s easy but its UI is beautiful and seems very professional. Our Idea for this post is to create an Instagram Dashboard having some descriptive statistics about a user’s profile like most frequent hashtags, top liked posts, engagement rate, etc. Having said that, we need an application that takes as input a user name and will scrape its information from Instagram to return the final Dashboard.
Getting the data from Instagram
This is the most difficult part because Instagram does not like to be scraped. Fortunately, there is a library called instagram-scraper which is a command-line application written in Python that scrapes Instagram profiles without any problems (just don’t use it too frequently).
Installation:
pip install instagram-scraperUsage:
instagram-scraper "{username}" --profile-metadata --media-metadata --media-types noneWith the command above, a folder named as the username will be created having a JSON file containing our data. Keep in mind that we need to run the code in the command-line.
Let’s run an example using my instagram account:
instagram-scraper "billybonaros" --profile-metadata --media-metadata --media-types noneWe can open the JSON file using python to see what we got.
js = json.load(open('billybonaros/billybonaros.json', encoding='utf-8'))

js.keys()
dict_keys(['GraphImages', 'GraphProfileInfo'])The GraphImages contains the data of the posts as likes, comments etc. and the GraphProfileInfo holds the user’s info.
js['GraphProfileInfo']
{'created_time': 1286323200,
 'info': {'biography': '📷 Artist \n⚡️ Artificial Intelligence & Data Science\n🖋 predictivehacks.com',
  'followers_count': 3486,
  'following_count': 2681,
  'full_name': 'Billy Bonaros',
  'id': '43176775',
  'is_business_account': False,
  'is_joined_recently': False,
  'is_private': False,
  'posts_count': 221,
  'profile_pic_url': 'https://instagram.fath3-3.fna.fbcdn.net/v/t51.2885-19/s150x150/181615592_215309037065818_7520216790200441065_n.jpg?tp=1&_nc_ht=instagram.fath3-3.fna.fbcdn.net&_nc_ohc=ICw1tUaN_LkAX-GFvSB&edm=ABfd0MgBAAAA&ccb=7-4&oh=062eef9cafacf4056c1d485e86f4b481&oe=60C57270&_nc_sid=7bff83'},
 'username': 'billybonaros'}
We will transform the GraphImages data into a Pandas Dataframe so we can work easier with it.
df=pd.DataFrame(js['GraphImages'])

df

As you can see, we got many useful data to work on. Now, let’s start building our app.
Building our Streamlit APP
The Form
Before we move on, make sure that you have installed Streamlit using the following command.
pip install streamlit
Start by creating a .py file and importing the required libraries for this project. Let’s call our file main.py.
import streamlit as st

import requests
import numpy as np
import pandas as pd
import os
import json
import pandas as pd
import numpy as np
import re
from datetime import datetime
import string
Now, we have to give our app a title and create the Form.
st.title('Instagram Dashboard')


with st.form(key='my_form'):

#st.text_input creates a form that gets a text input
    username = st.text_input(label='Enter User Name')

#st.form_submit_button creates a submit button
    submit_button = st.form_submit_button(label='Submit')
Believe it or not, our landing page is ready! We can add many other types of forms but we only need a text input and a submit button. You can find out more in this cheatsheet.
To run our app you only need to type the following in the project’s directory:
streamlit run main.py If you got the following output, that means that your app is running.
  You can now view your Streamlit app in your browser.

  Local URL: http://localhost:8501
  Network URL: http://192.168.1.7:8501
To access the app, head over to http://localhost:8501
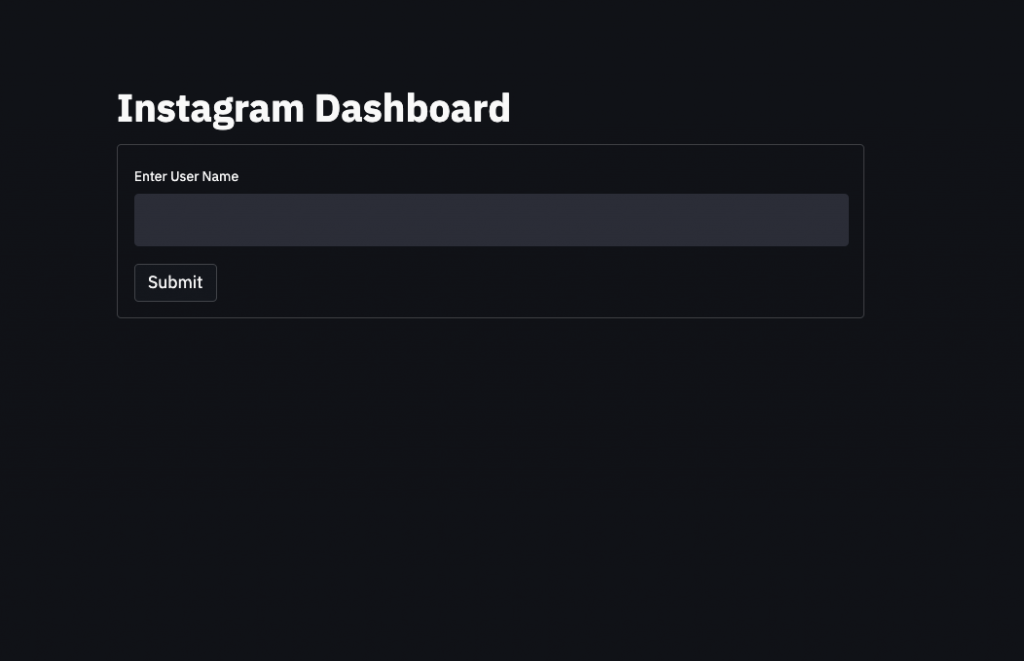
Pretty cool, right?
The Output
To continue we only have to determine if the submit button is pressed. This can be done using an if statement and then inside it we will add out code for the output.
Streamlit lets you add many different types of outputs but we will only use the following:
- Text: st.write(‘Text’)
- Title: st.title(‘Text’)
- Header: st.header(‘Text’)
- Subheader: st.subheader(‘Text’)
- Dataframe: st.table(dataframe)
- Image: st.image(‘image_path’)
- Bar Chart: st.bar_chart(data)
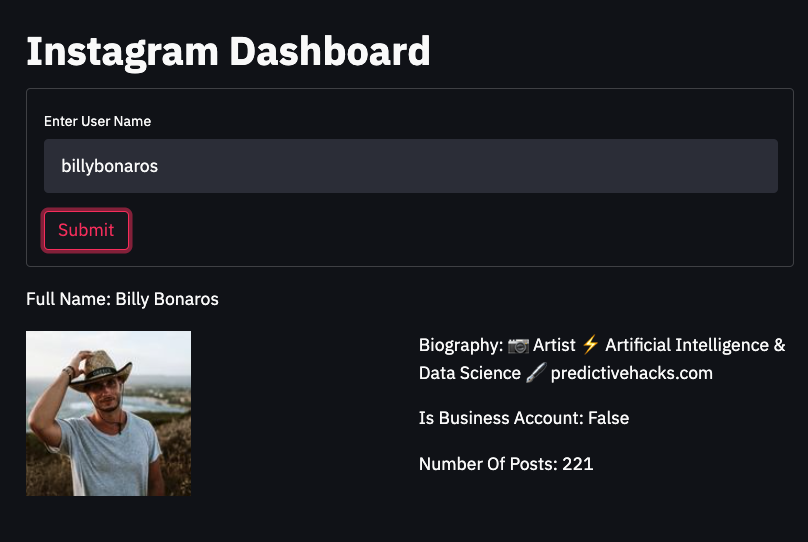
Firstly, let’s get the data from the js[‘GraphProfileInfo’] and show the full name of the user, the biography, the number of posts, and if it’s a business account or not. Then we can download the image from the profile_pic_url and show the profile picture of the user.
if submit_button:

#before we run the scraping script,
#we are checking if the directory exists so we will not scrape the data
#from a user that we already have the data
#this will help us test the app better because
#the data will load fast and we will not get banned from Instagram
#by scraping too frequently

    if not os.path.exists(f'{username}'):
        os.system(f'instagram-scraper "{username}" --profile-metadata  --media-metadata  --media-types none')

    js = json.load(open(f'{username}/{username}.json', encoding='utf-8'))
    df=pd.DataFrame(js['GraphImages'])


#get the profile_pic_url from json
    prof_pic=js['GraphProfileInfo']['info']['profile_pic_url']


#download the image in a folder called static I created
    response = requests.get(prof_pic)
    filename="static/image.jpg"
    with open(filename, "wb") as f:
        f.write(response.content)

#show the full name
    st.write(f"Full Name: {js['GraphProfileInfo']['info']['full_name']}")


#we can format the output into as many columns as we want using columns
#and instead of using st. we are using column_name. to show the outputs in the
#selected column. Here we are splitting the outputs into 2 columns
#in col1 one will be the image and in col2 the info.

    col1, col2 = st.columns(2)
    col1.image(filename)
    col2.write(f"Biography: {js['GraphProfileInfo']['info']['biography']}")
    col2.write(f"Is Business Account: {js['GraphProfileInfo']['info']['is_business_account']}")
    col2.write(f"Number Of Posts: {js['GraphProfileInfo']['info']['posts_count']}")
The nice thing about Streamlit is that after every change you don’t have to rerun the streamlit run main.py but instead just head over in the right corner and press rerun.
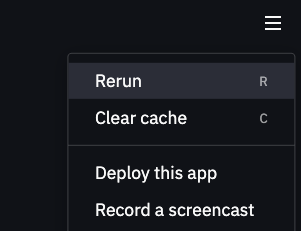
Let’s rerun the app and submit the username again.
Continuing, we can apply some data manipulation techniques to get the likes, the date, the comments, the hashtags from the dataframe containing the posts info(df). Also, we can add in col2 the engagement rate (((total_likes+total_comments)/posts)/followers) and the average number of posts per month.
#number of likes
df['likes']=df['edge_media_preview_like'].apply(lambda x: x['count'])
#number of comments
df['comments']=df['edge_media_to_comment'].apply(lambda x: x['count'])

#transform the timestamp to datetime object
df['date']=df['taken_at_timestamp'].apply(datetime.fromtimestamp)

#extract dayofweek, month, week, year, ym
df['dayofweek']=df['date'].dt.dayofweek
df['month']=df['date'].dt.month
df['week']=df['date'].dt.week
df['year']=df['date'].dt.year
df['ym']=df['year'].astype(str)+df['month'].astype(str)

engagement_rate=(((df['likes'].sum()+df['comments'].sum())/len(df))/js['GraphProfileInfo']['info']['followers_count'])*100

col2.write(f"Average Posts Per Month: {round(df.groupby('ym').size().mean(),2)}")
col2.write(f"Engagement Rate: {round(engagement_rate,2)}%")
We can add some plots to our dashboard like the number of posts per week-day and the number of posts per month.
x=df.groupby('dayofweek').size()
st.subheader('Number Of Posts Per Week-Day')
st.bar_chart(pd.DataFrame(x).rename(columns={0: 'Number Of Posts'}))

x=df.groupby('month').size()
st.subheader('Number Of Posts Per Month')
st.bar_chart(pd.DataFrame(x).rename(columns={0: 'Number Of Posts'}))

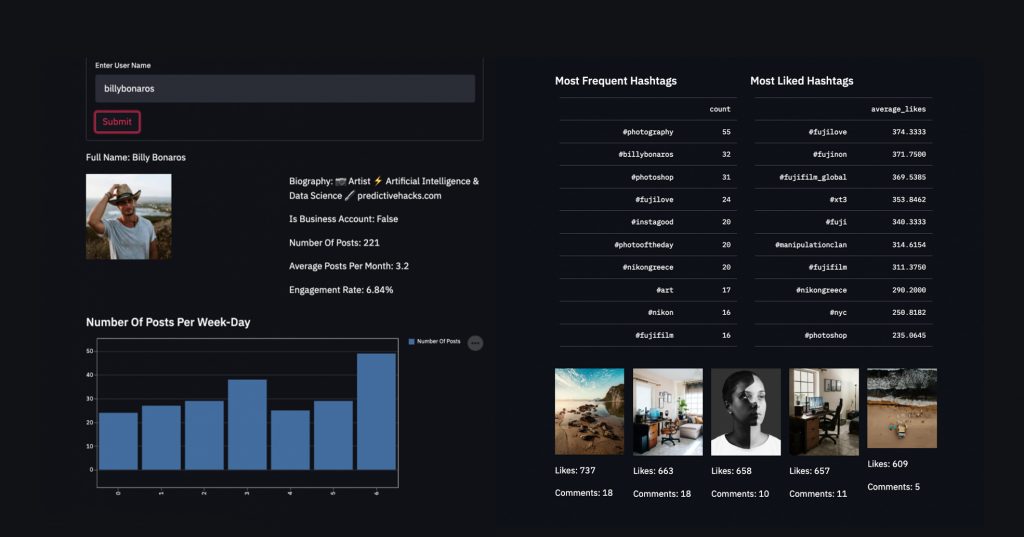
My final App
Using the same techniques we talked about above I created the following app. I added the most frequent and liked hashtags and the top liked posts. Also, I added an error message when the scraping script is not working due to Instagram’s limits.
import streamlit as st

import requests
import numpy as np
import pandas as pd
import os
import json
import pandas as pd
import numpy as np
import re
from datetime import datetime
import string

st.title('Instagram Dashboard')


with st.form(key='my_form'):
    username = st.text_input(label='Enter User Name')
    submit_button = st.form_submit_button(label='Submit')


import os


if submit_button:
    if not os.path.exists(f'{username}'):
        os.system(f'instagram-scraper "{username}" --profile-metadata  --media-metadata  --media-types none')
    try:
        js = json.load(open(f'{username}/{username}.json', encoding='utf-8'))


        df=pd.DataFrame(js['GraphImages'])


        prof_pic=js['GraphProfileInfo']['info']['profile_pic_url']

        response = requests.get(prof_pic)
        filename="static/image.jpg"
        with open(filename, "wb") as f:
            f.write(response.content)

    #data
        df['likes']=df['edge_media_preview_like'].apply(lambda x: x['count'])

        df['comments']=df['edge_media_to_comment'].apply(lambda x: x['count'])

        engagement_rate=(((df['likes'].sum()+df['comments'].sum())/len(df))/js['GraphProfileInfo']['info']['followers_count'])*100

        df['date']=df['taken_at_timestamp'].apply(datetime.fromtimestamp)

        df['dayofweek']=df['date'].dt.dayofweek
        df['month']=df['date'].dt.month
        df['week']=df['date'].dt.week
        df['year']=df['date'].dt.year
        df['ym']=df['year'].astype(str)+df['month'].astype(str)

        df['dayofweek']=df['dayofweek'].replace([0,1,2,3,4,5,6],['Mon.', 'Tue.', 'Wed.','Thu.','Fri.','Sat.','Sun.'])

        col1, col2 = st.columns(2)
        col1.image(filename)
        col2.write(f"Full Name: {js['GraphProfileInfo']['info']['full_name']}")
        col2.write(f"Biography: {js['GraphProfileInfo']['info']['biography']}")
        col2.write(f"Is Business Account: {js['GraphProfileInfo']['info']['is_business_account']}")
        col2.write(f"Number Of Posts: {js['GraphProfileInfo']['info']['posts_count']}")
        col2.write(f"Average Posts Per Month: {round(df.groupby('ym').size().mean(),2)}")
        col2.write(f"Engagement Rate: {round(engagement_rate,2)}%")


        x=df.groupby('dayofweek').size()
        st.subheader('Number Of Posts Per Week-Day')
        st.bar_chart(pd.DataFrame(x).rename(columns={0: 'Number Of Posts'}))

        x=df.groupby('month').size()
        st.subheader('Number Of Posts Per Month')
        st.bar_chart(pd.DataFrame(x).rename(columns={0: 'Number Of Posts'}))

        def get_caption(x):
            try:
                return(x['edges'][0]['node']['text'])
            except:
                return('')

        df['caption']=df['edge_media_to_caption'].apply(get_caption)

        df['hashtags']=df['caption'].apply(lambda x: re.findall("(#\w+)",x))


        hashtags=df[['hashtags','likes']].explode('hashtags').groupby('hashtags').agg({'likes':['count','mean']})
        hashtags.columns=['count','average_likes']
        most_liked_hashtags=hashtags.query('count>10').sort_values('average_likes',ascending=False)

        col3, col4 = st.columns(2)
        col3.subheader('Most Frequent Hashtags')
        col3.table(hashtags.sort_values('count',ascending=False)[['count']].head(10))

        col4.subheader("Most Liked Hashtags")
        col4.table(most_liked_hashtags.sort_values('average_likes',ascending=False)[['average_likes']].head(10))


        topurls=list(df.sort_values('likes',ascending=False)['display_url'].head())

        toplikes=list(df.sort_values('likes',ascending=False)['likes'].head())
        topcomments=list(df.sort_values('likes',ascending=False)['comments'].head())

        n=1
        for i in topurls:
            response = requests.get(i)
            filename=f"static/{n}.jpeg"
            with open(filename, "wb") as f:
                f.write(response.content)
            n+=1


        col5,col6,col7,col8,col9=st.columns(5)
        col5.image("static/1.jpeg")
        col5.write(f"Likes: {toplikes[0]}")
        col5.write(f"Comments: {topcomments[0]}")

        col6.image("static/2.jpeg")
        col6.write(f"Likes: {toplikes[1]}")
        col6.write(f"Comments: {topcomments[1]}")

        col7.image("static/3.jpeg")
        col7.write(f"Likes: {toplikes[2]}")
        col7.write(f"Comments: {topcomments[2]}")

        col8.image("static/4.jpeg")
        col8.write(f"Likes: {toplikes[3]}")
        col8.write(f"Comments: {topcomments[3]}")

        col9.image("static/5.jpeg")
        col9.write(f"Likes: {toplikes[4]}")
        col9.write(f"Comments: {topcomments[4]}")

    except:
        st.error('Instagram limit is reached.')

Summing it up
Streamlit is an easy and professional way to create web apps. The purpose of this post is to make you use your imagination to create your own powerful app. Experiment with it, use machine learning, get dominant colors of the post images, find the best words to use, etc.


