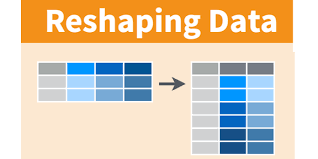
Let’s say that you have applied your Clustering algorithm and you would like to report the distribution of the categorical variables per cluster in a “tidy” report. Below you can see a suggestion of how you can do it in R.
Generate the Data
Let’s assume that we came up with 3 clusters such as “C1, C2 and C3” and that we have 3 attributes such as:
- Gender: “M”, “F”
- Type: “A”, “B”, “C”, “D”
- Category: “High”, “Medium”, “Low”
library(tidyverse)

set.seed(5)

df1<-tibble(ID=seq_len(500))%>%
     mutate(Cluster = "C1",
            Gender=sample(c("M", "F"), n(), replace=TRUE, prob=c(0.6, 0.4)),
            Type=sample(c("A", "B", "C", "D"), n(), replace=TRUE, prob=c(0.20, 0.3, 0.4, 0.1)),
            Category=sample(c("High", "Medium", "Low"), n(), replace=TRUE, prob=c(0.1, 0.6, 0.3)))

df2<-tibble(ID=seq_len(300))%>%
  mutate(Cluster = "C2",
         Gender=sample(c("M", "F"), n(), replace=TRUE, prob=c(0.4, 0.6)),
         Type=sample(c("A", "B", "C", "D"), n(), replace=TRUE, prob=c(0.40, 0.1, 0.2, 0.3)),
         Category=sample(c("High", "Medium", "Low"), n(), replace=TRUE, prob=c(0.7, 0.2, 0.1)))

df3<-tibble(ID=seq_len(200))%>%
  mutate(Cluster = "C3",
         Gender=sample(c("M", "F"), n(), replace=TRUE, prob=c(0.2, 0.8)),
         Type=sample(c("A", "B", "C", "D"), n(), replace=TRUE, prob=c(0.5, 0.3, 0.1, 0.1)),
         Category=sample(c("High", "Medium", "Low"), n(), replace=TRUE, prob=c(0.1, 0.2, 0.7)))

df<-rbind.data.frame(df1, df2, df3)

df
# A tibble: 1,000 x 5
      ID Cluster Gender Type  Category
   <int> <chr>   <chr>  <chr> <chr>
 1     1 C1      M      C     Medium
 2     2 C1      F      C     Medium
 3     3 C1      F      C     Medium
 4     4 C1      M      B     Low
 5     5 C1      M      B     Low
 6     6 C1      F      C     Medium
 7     7 C1      M      C     Medium
 8     8 C1      F      B     High
 9     9 C1      F      C     Medium
10    10 C1      M      A     Medium
# ... with 990 more rows
Report the Distribution of Attributes
attributes <- names(df[3:dim(df)[2]])


output<-NULL

for (a in attributes) {

  tmp<-df%>%group_by_(a, "Cluster")%>% summarise(n = n())%>%
    group_by(Cluster)%>%mutate(Prop=n/(sum(n)))%>%
    ungroup()%>%select(-n)%>%
    spread(Cluster, Prop)%>%mutate(Attribute = a)%>%select(Attribute, everything())
  colnames(tmp)[1:2]<-c("attribute", "values")

  output<-rbind(output, tmp)

}

output
# A tibble: 9 x 5
  attribute values    C1    C2    C3
  <chr>     <chr>  <dbl> <dbl> <dbl>
1 Gender    F      0.398 0.593 0.78
2 Gender    M      0.602 0.407 0.22
3 Type      A      0.188 0.413 0.425
4 Type      B      0.318 0.1   0.365
5 Type      C      0.39  0.193 0.105
6 Type      D      0.104 0.293 0.105
7 Category  High   0.114 0.683 0.065
8 Category  Low    0.312 0.103 0.75
9 Category  Medium 0.574 0.213 0.185
Another approach will be to work with the map functions from the purrr package. The issue with this solution is that it does not report the attributes/levels to different columns.
df %>%
  split(.$Cluster) %>%
  map(select, -c(ID, Cluster)) %>%
  map_depth(2, . %>% table %>% prop.table) %>%
  map(unlist) %>%
  data.frame
And we get:
                   C1        C2    C3
Gender.F        0.398 0.5933333 0.780
Gender.M        0.602 0.4066667 0.220
Type.A          0.188 0.4133333 0.425
Type.B          0.318 0.1000000 0.365
Type.C          0.390 0.1933333 0.105
Type.D          0.104 0.2933333 0.105
Category.High   0.114 0.6833333 0.065
Category.Low    0.312 0.1033333 0.750
Category.Medium 0.574 0.2133333 0.185


2 thoughts on “How to Report the Distribution of Attributes per Cluster”
Maybe it is good example to introduce split-map technique?
> df %>%
split(.$Cluster) %>%
map(select, -c(ID, Cluster)) %>%
map_depth(2, . %>% table %>% prop.table) %>%
map(unlist) %>%
data.frame
C1 C2 C3
Gender.F 0.398 0.5933333 0.780
Gender.M 0.602 0.4066667 0.220
Type.A 0.188 0.4133333 0.425
Type.B 0.318 0.1000000 0.365
Type.C 0.390 0.1933333 0.105
Type.D 0.104 0.2933333 0.105
Category.High 0.114 0.6833333 0.065
Category.Low 0.312 0.1033333 0.750
Category.Medium 0.574 0.2133333 0.185
Thank you Lukasz, Great example! I will add it!