
Description
This dataset contains the votes From Country to To Country for Eurovision 2016. There are the Jury Votes and the Televote. We would like to see how people voted in Eurovision 2016 and for that reason, we will consider only the Televote. Our ultimate goal is to create a dendrogram that will show the relationship between countries. The algorithm will be the Hierarchical Clustering.
Data Processing
We will load the data and we will keep only three columns such as the From Country, To Country and the Televote Rank. Then we will reshape the data where the rows will be the From Country ,the columns will the To Country and the values will be the Televote Rank. Notice that each country cannot vote itself and for that reason will be NA values. We will impute the NAs with the \(Televote Rank=1\) assuming that each country would have given the highest score to itself if that was allowed. Bear in mind that we want to cluster the countries based on their vote preferences.
from scipy.cluster.hierarchy import linkage, dendrogram
import pandas as pd
import numpy as np
import matplotlib.pyplot as plt
import seaborn as sns
from scipy.cluster.vq import whiten
%matplotlib inline
eurovision = pd.read_csv("eurovision-2016.csv")
televote_Rank = eurovision.pivot(index='From country', columns='To country', values='Televote Rank')
# fill NAs with 1
televote_Rank.fillna(1, inplace=True)
Hierarchical Clustering
Since we have the data in the right format, we can whiten them although is not necessary since all features come from the same distribution and we are ready to run the Hierarchical Clustering and to represent the dendrogram. Notice, that the rows names are the From Country column.
df_scaled = whiten(televote_Rank.to_numpy())
# Calculate the linkage: mergings
mergings = linkage(df_scaled, method='ward')


plt.figure(figsize=(20,12))

# Plot the dendrogram
dn = dendrogram(
    mergings,
    labels=np.array(televote_Rank.index),
    leaf_rotation=90,
    leaf_font_size=14
)
plt.show()
Focusing on the Dendrogram
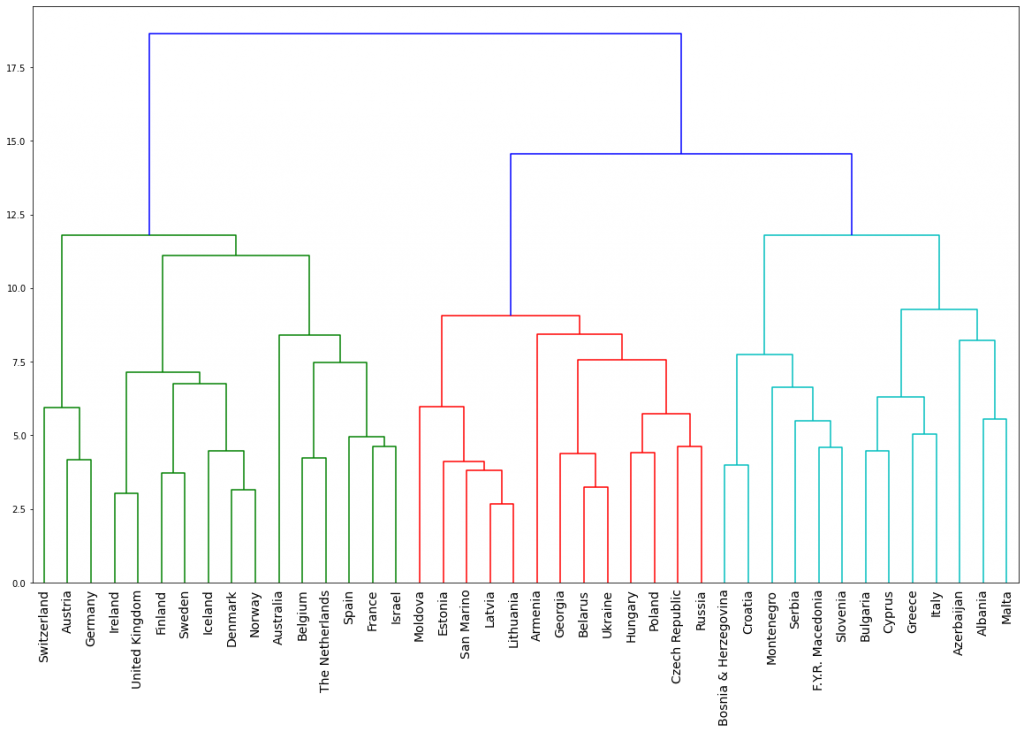
Let’s have a close look at the dendrogram. You will notice that the following countries appear to be close:
- Bosnia & Herzegovina, Croatia, Montenegro, Serbia, F.Y.R. Macedonia, Slovenia

Also, you will notice that the Baltic Counties like Latvia, Lithuania, Estonia are close. Some other countries which are close:
- Germany and Austria mainly and then Switzerland can be one group
- Ireland is close to the United Kingdom
- Finland, Sweden, Iceland, Denmark, Norway can be another group
- Belgium is close to the Netherlands
- Greece is close to Italy, Cyprus and Boulgaria
Apart from defining how close are some countries, we can say how “far” they are in terms of voting. For example, Switzerland is far away from Albania.
Conclusion
We took into consideration only the results of Eurovision 2016 so we cannot drive safe conclusions. However is clear that there are many factors that affect how people are voted in Eurovision. Generally, people tend to vote for countries which are close geographically or culturally.
Want to learn more?
If you found this post helpful, you can have a look at other related posts:


1 thought on “Hierarchical Clustering of Countries based on Eurovision Votes”