

Below we represent some examples of how you can draw “hearts” in R!
t = seq(0,60,len=100)
plot(c(-8,8),c(0,20),type='n',axes=FALSE,xlab='',ylab='')
x = -.01*(-t^2+40*t+1200)*sin(pi*t/180)
y = .01*(-t^2+40*t+1200)*cos(pi*t/180)
lines(x,y, lwd=4)
lines(-x,y, lwd=4)
text(0,7,"Predictive Hacks Wish You\n Happy Valentine's Day",col='blue',cex=2.5)

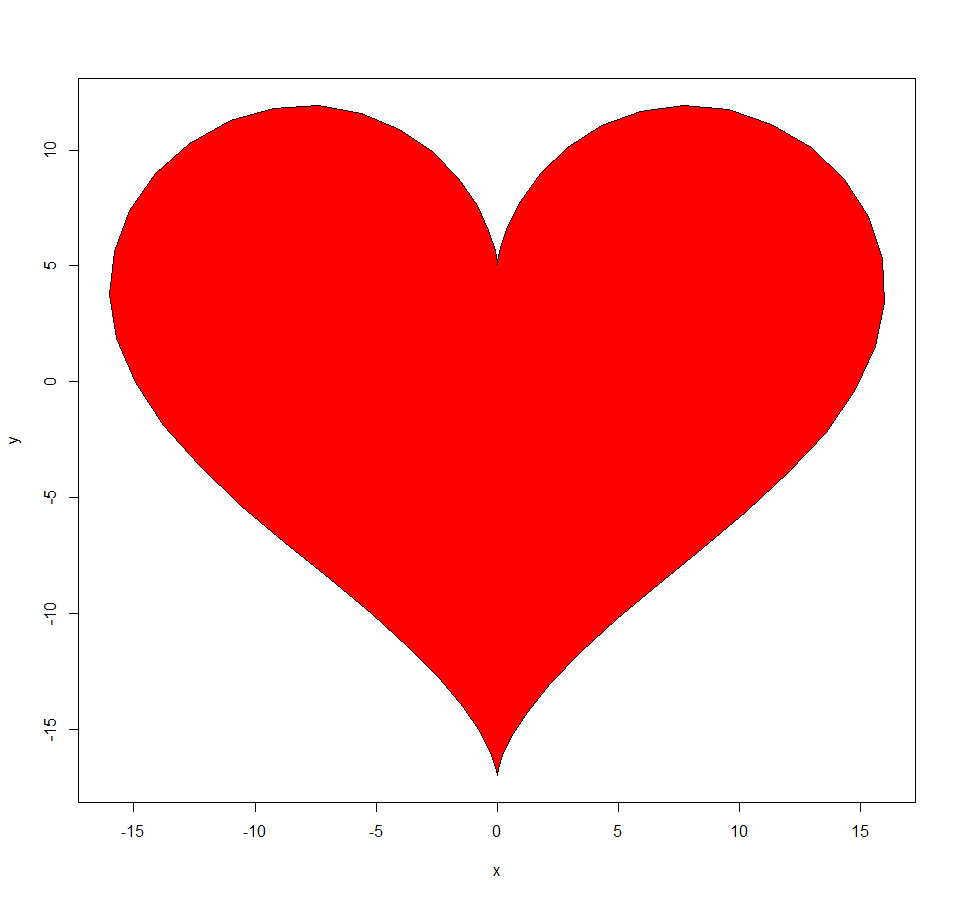
dat<- data.frame(t=seq(0, 2*pi, by=0.1) )
xhrt <- function(t) 16*sin(t)^3
yhrt <- function(t) 13*cos(t)-5*cos(2*t)-2*cos(3*t)-cos(4*t)
dat$y=yhrt(dat$t)
dat$x=xhrt(dat$t)
with(dat, plot(x,y, type="l"))
with(dat, polygon(x,y, col="red"))
library(dplyr)
library(tidyr)
library(broom)
library(ggplot2)
library(gganimate)

d <- data_frame(t = seq(-pi, 0, .01),
                x1 = 16 * (sin(t)) ^ 2,
                x2 = -x1,
                y = 13 * cos(t) -
                  5 * cos(2 * t) -
                  2 * cos(3 * t) -
                  cos(4 * t)) %>%
  gather(side, x, x1, x2)

heart <- d %>%
  inflate(t1 = max(d$t) + seq_len(20)) %>%
  arrange(((side == "x2") - 1) * t)

g <- ggplot(d, aes(x, y, frame = round(t, 1))) +
  geom_path(aes(cumulative = TRUE, group = side)) +
  geom_polygon(aes(alpha = t1, frame = t1), data = heart, fill = "red", show.legend = FALSE) +
  geom_text(aes(x = 0, y = 0, label = "Happy Valentine's Day", alpha = t1, frame = t1),
            data = heart, size = 8, color = "white", show.legend = FALSE) +
  coord_equal() +
  theme_bw()

s <- gg_animate(g, interval = .1,
                title_frame = FALSE)


1 thought on “Happy Valentine’s Day in R”
Great content! Super high-quality! Keep it up! 🙂