
When we are dealing with time series data, it is quite common approach to run at least on time series model like ARIMA. In this post we give an example of an ARIMA model with Drift.
Time Series Data
For this example we consider the monthly arrivals of a Hotel. Let’s have a look at the data.
library(tidyverse)
library(forecast)

df<-read.csv("data.tsv", sep="\t")
df$Date<-as.Date(as.character(df$Date), format = "%Y-%m-%d")

df

df%>%ggplot(aes(x=Date, y=Arrivals))+geom_point()+geom_line()+ggtitle("Arrivals Across Time")
Date	Arrivals
2016-01-01	171
2016-02-01	172
2016-03-01	172
2016-04-01	361
2016-05-01	349
2016-06-01	356
2016-07-01	458
2016-08-01	458
2016-09-01	451
2016-10-01	285
2016-11-01	292
2016-12-01	287
2017-01-01	191
2017-02-01	197
2017-03-01	198
2017-04-01	463
2017-05-01	445
2017-06-01	452
2017-07-01	524
2017-08-01	527
2017-09-01	530
2017-10-01	304
2017-11-01	312
2017-12-01	306
2018-01-01	228
2018-02-01	227
2018-03-01	233
2018-04-01	503
2018-05-01	490
2018-06-01	491
2018-07-01	617
2018-08-01	623
2018-09-01	615
2018-10-01	358
2018-11-01	375
2018-12-01	363

From the plot above we can see that there is a seasonality effect, where during Summer months there are more arrivals than during the Winter months. Also there is a trend, for instance the arrivals of July 2018 > July 2017 > July 2016.
Build the ARIMA model
We use the auto.arima function of the forecast package which tries to find out the optimum ARIMA model, but since we have a drift we have to set D=1. Also we need to define that our data is a monthly time series process (i.e. frequency=12)
ArimaModel<-auto.arima(ts(df$Arrivals, frequency = 12, start = c(2016,1), end=c(2018,12)), D=1)
summary(ArimaModel)
Series: ts(df$Arrivals, frequency = 12, start = c(2016, 1), end = c(2018,      12))
ARIMA(1,0,0)(0,1,0)[12] with drift

Coefficients:
         ar1   drift
      0.5916  4.4073
s.e.  0.1620  0.8985

sigma^2 estimated as 563.6:  log likelihood=-109.24
AIC=224.48   AICc=225.68   BIC=228.01

Training set error measures:
                    ME     RMSE      MAE        MPE     MAPE      MASE       ACF1
Training set 0.8138445 18.55921 11.02035 -0.6465763 3.050286 0.2017455 0.06893409
Forecast with the ARIMA model
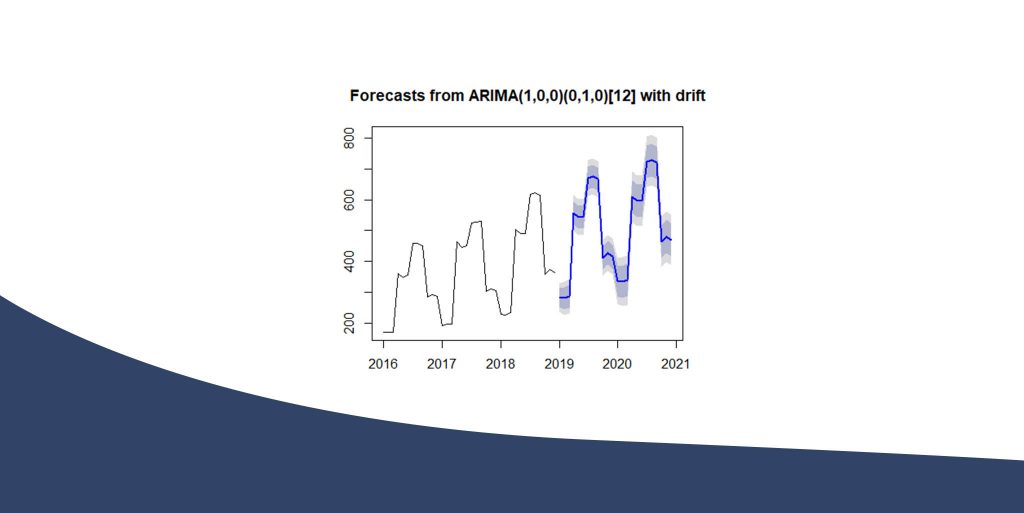
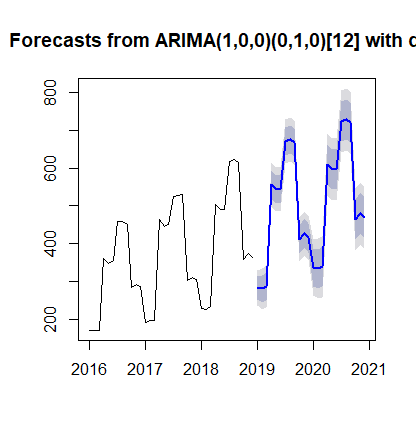
We are going to predict the arrivals of that hotel for 2 years ahead providing also the Confidence Intervals (80% and 95%)!
forecast(ArimaModel, h=24)

plot(forecast(ArimaModel, h=24))
         Point Forecast    Lo 80    Hi 80    Lo 95    Hi 95
Jan 2019       283.3207 252.8954 313.7461 236.7892 329.8523
Feb 2019       281.3272 245.9760 316.6784 227.2622 335.3922
Mar 2019       286.7395 249.8191 323.6598 230.2746 343.2043
Apr 2019       556.3917 518.9377 593.8458 499.1107 613.6728
May 2019       543.1860 505.5469 580.8251 485.6220 600.7500
Jun 2019       544.0643 506.3607 581.7679 486.4016 601.7270
Jul 2019       669.9923 632.2661 707.7185 612.2951 727.6895
Aug 2019       675.9497 638.2156 713.6838 618.2404 733.6590
Sep 2019       667.9245 630.1877 705.6613 610.2110 725.6380
Oct 2019       410.9096 373.1718 448.6474 353.1946 468.6246
Nov 2019       427.9008 390.1626 465.6389 370.1852 485.6163
Dec 2019       415.8955 378.1573 453.6338 358.1798 473.6112
Jan 2020       336.2132 287.7025 384.7238 262.0225 410.4038
Feb 2020       334.2179 282.4638 385.9719 255.0668 413.3689
Mar 2020       339.6290 286.7867 392.4713 258.8137 420.4443
Apr 2020       609.2806 556.0627 662.4986 527.8909 690.6704
May 2020       596.0745 542.7258 649.4233 514.4846 677.6644
Jun 2020       596.9526 543.5581 650.3471 515.2928 678.6124
Jul 2020       722.8805 669.4700 776.2909 641.1962 804.5647
Aug 2020       728.8378 675.4217 782.2539 647.1449 810.5306
Sep 2020       720.8125 667.3945 774.2306 639.1167 802.5084
Oct 2020       463.7976 410.3789 517.2163 382.1007 545.4945
Nov 2020       480.7888 427.3698 534.2077 399.0915 562.4860
Dec 2020       468.7835 415.3645 522.2026 387.0861 550.4809
ARIMA Plot of Forecasts


1 thought on “ARIMA in R”