

Exploratory data analysis is a very important procedure in Data Science. Whatever we want to do with the data, we have to summarise their main characteristics so we can have a better understanding of them. Sometimes this can be hard to do and often we end up with big and complex outputs. In this post, we will show you 3 ways to perform quick exploratory data analysis in a nice readable format.
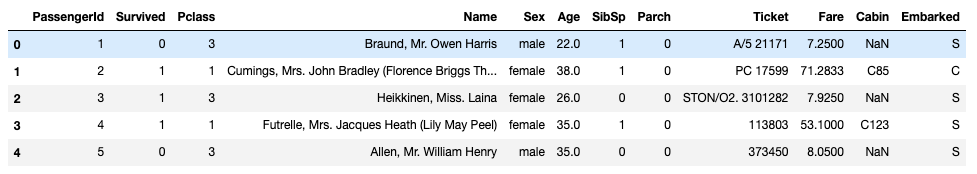
We will use the Titanic dataset from Kaggle.
import pandas as pd
import numpy as np

df=pd.read_csv('train.csv')
df.head()
1. Tensorflow Data Validation
TensorFlow Data Validation (TFDV) is a library for exploring and validating machine learning data. It contains a very useful function that can generate statistics from a data frame with just one line of code.
import tensorflow_data_validation as tfdv

stats = tfdv.generate_statistics_from_dataframe(df)

tfdv.visualize_statistics(stats)
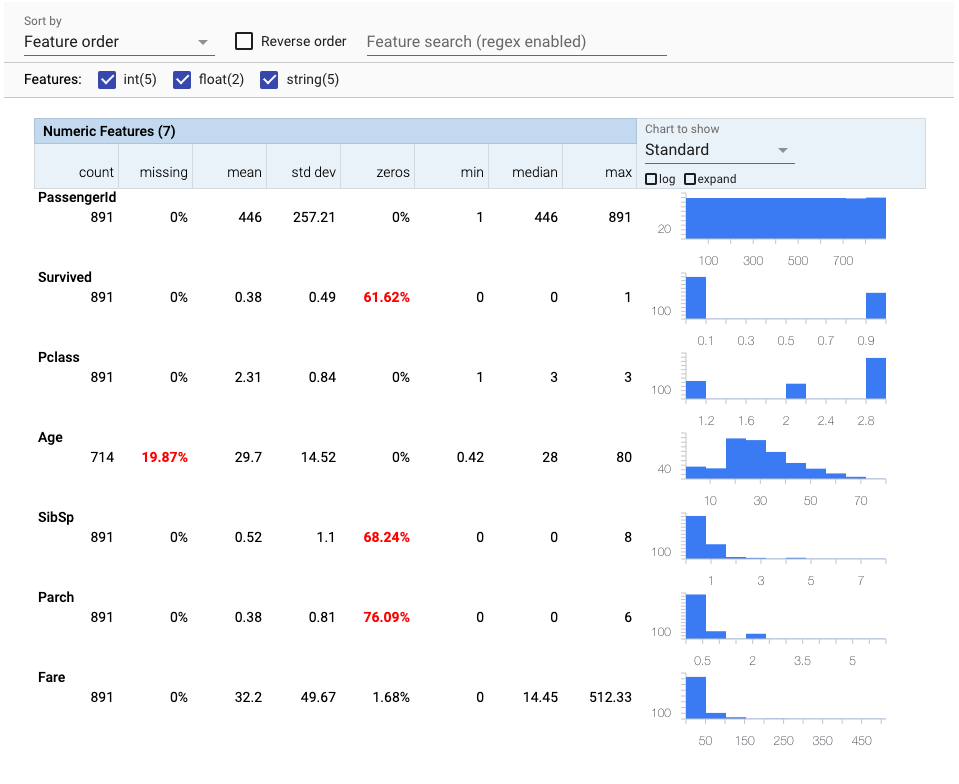

As you can see, we are getting in a nice format a nice summarization of our numeric and categorical features.
2. Quickda
Quickda is an amazing library that is capable to produce a professional HTML interactive output.
import pandas as pd
from quickda.explore_data import *
from quickda.clean_data import *
from quickda.explore_numeric import *
from quickda.explore_categoric import *
from quickda.explore_numeric_categoric import *
from quickda.explore_time_series import *

explore(df, method='profile', report_name='Titanic')
The output is an interactive report that contains many statistics of the data such as a complete variable analysis and the correlation between them. Quickda is a great option when we want to share the analysis with others since we can save it as an HTML file.
3. Pandas
The Pandas library may not be fancy but is one of the most powerful and useful libraries in data science. We will show you how you can get all the information you want for a basic exploratory data analysis. The main advantage of pandas is that can handle big data where the other libraries can’t.
pd.DataFrame({"values":{col:df[col].unique() for col in df},
              'type':{col:df[col].dtype for col in df},
              'unique values':{col:len(df[col].unique()) for col in df},
              'NA values':{col:str(round(sum(df[col].isna())/len(df),2))+'%' for col in df},
              'Duplicated Values':{col:sum(df[col].duplicated()) for col in df}
             })
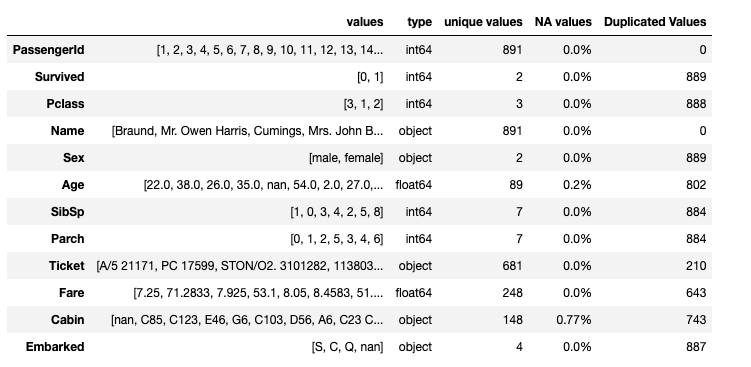
This is just an example of the power of pandas. Of course, you can do many things such as count the values, plot histograms, etc. but sometimes a data frame like the above is the only information we need.
Summing it up
Tensorflow Data Validation and Quickda can give us automatically a great presentation of the characteristics of our data. We encourage you to take a closer look at them because they are both powerful libraries with many capabilities. However, they can’t handle big data and it will be overkill to use them when you only want a basic understanding of your data. Pandas, on the other hand, is light and fast and can handle easily big data. You can get great results if you use it correctly.


