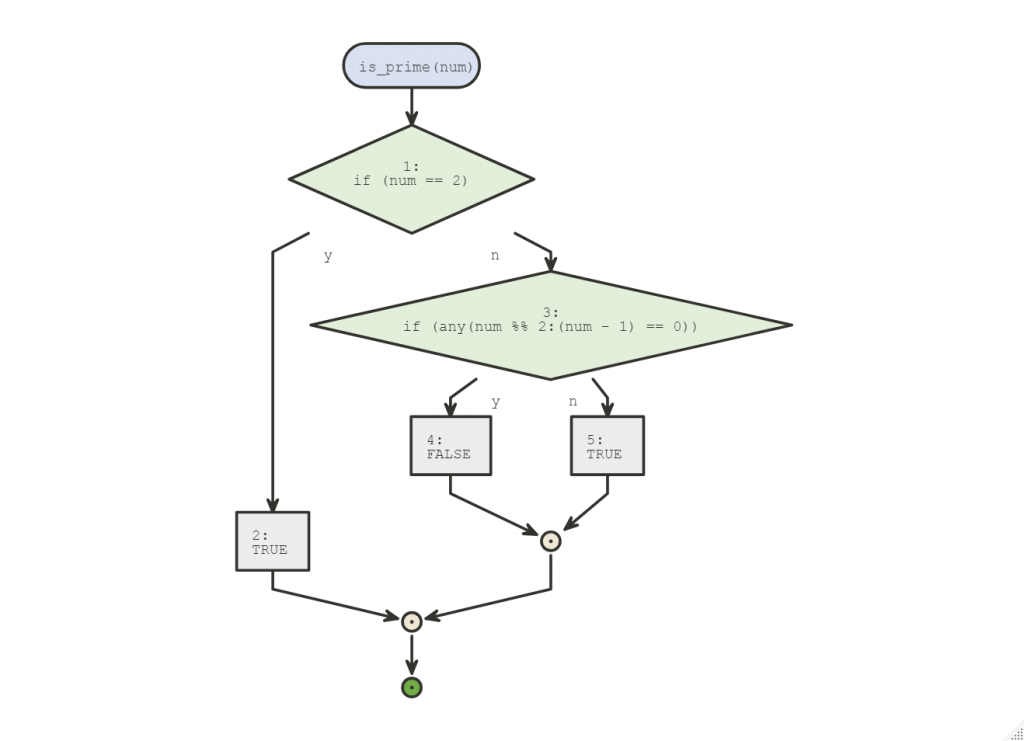
The “flow” package visualizes as flow diagrams the logic of functions, expressions, or scripts. Let’s take an example of a function that checks if a number is a prime or not.
is_prime <- function(num) {
   if (num == 2) {
      TRUE
   } else if (any(num %% 2:(num-1) == 0)) {
      FALSE
   } else {
      TRUE
   }
}

is_prime(997)
[1] TRUEWe can get the flow diagram by running:
library(flow)
flow_view(is_prime)


