
We will provide a practical example of how we can run a Chi-Square Test in Python. Assume that we want to test if there is a statistically significant difference in Genders (M, F) population between Smokers and Non-Smokers. Let’s generate some sample data to work on it.
Sample Data
import pandas as pd
import numpy as np
from scipy.stats import chi2_contingency

import seaborn as sns
import matplotlib.pyplot as plt
%matplotlib inline
df = pd.DataFrame({'Gender' : ['M', 'M', 'M', 'F', 'F'] * 10,
                   'isSmoker' : ['Smoker', 'Smoker', 'Non-Smpoker', 'Non-Smpoker', 'Smoker'] * 10
                  })
df.head()
	Gender	isSmoker
0	M	Smoker
1	M	Smoker
2	M	Non-Smpoker
3	F	Non-Smpoker
4	F	Smoker
Contingency Table
To run the Chi-Square Test, the easiest way is to convert the data into a contingency table with frequencies. We will use the crosstab command from pandas.
contigency= pd.crosstab(df['Gender'], df['isSmoker'])
contigency
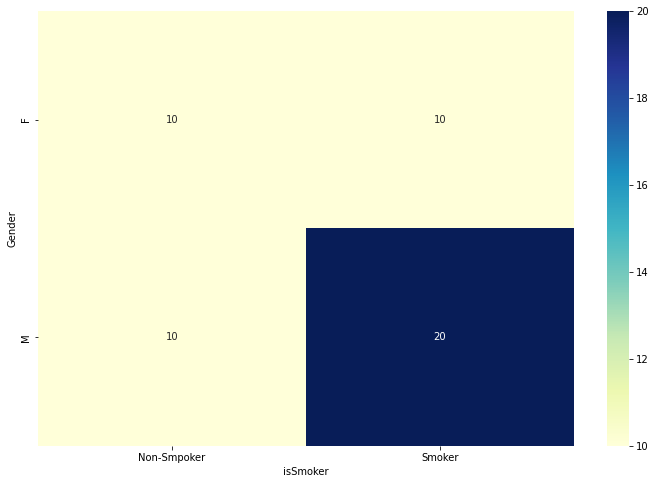
| isSmoker | Non-Smpoker | Smoker |
|---|---|---|
| Gender | ||
| F | 10 | 10 |
| M | 10 | 20 |
Let’s say that we want to get the percentages by Gender (row)
contigency_pct = pd.crosstab(df['Gender'], df['isSmoker'], normalize='index')
contigency_pct
| isSmoker | Non-Smpoker | Smoker |
|---|---|---|
| Gender | ||
| F | 0.500000 | 0.500000 |
| M | 0.333333 | 0.666667 |
If we want the percentages by column, then we should write normalize=’column’ and if we want the total percentage then we should write normalize=’all’
Heatmaps
An easy way to see visually the contingency tables are the heatmaps.
plt.figure(figsize=(12,8))
sns.heatmap(contigency, annot=True, cmap="YlGnBu")
Chi-Square Test
Now that we have built the contingency table we can pass it to chi2_contingency function from the scipy package which returns the:
- chi2: The test statistic
- p: The p-value of the test
- dof: Degrees of freedom
- expected: The expected frequencies, based on the marginal sums of the table
# Chi-square test of independence.
c, p, dof, expected = chi2_contingency(contigency)
p
0.3767591178115821Inference
The p-value is 37.67% which means that we do not reject the null hypothesis at 95% level of confidence. The null hypothesis was that Smokers and Gender are independent. In this example, the contingency table was 2×2. We could have applied z-test for proportions instead of Chi-Square test. Notice that the Chi-Square test can be extended to m x n contingency tables.


1 thought on “How to run Chi-Square Test in Python”
How to extend the process for m x n contingency tables?