

One of the most important statistical tests is the T-test also known as the student’s T-test. In this post, we will show you how to use it for hypothesis testing.
We will create some dummy data and let’s assume that they represent the likes on Instagram for some male and female users in one day. We will see if there is any difference in their mean thus the number of likes the males do is bigger than the number of likes of females.
The Hypothesis
Let’s beging by setting up our two hypothesis.
Null Hypothesis (H0): Population mean for males – Population mean for females = 0
Alternative Hypothesis (H1): Population mean for males – Population mean for females > 0
Now, let’s set our significance level to 0.05 or 5%. That means that if our outcome has less that 5% chance of occuring we will reject the Null Hypothesis.
import pandas as pd
import numpy as np
import random
from numpy.random import seed
from numpy.random import randn
from scipy.stats import ttest_ind
from scipy.stats import t

seed(1)

df=pd.DataFrame({"female":np.random.randint(10, 100, size=10),"male":np.random.randint(10, 140, size=10)})

print(df.head())
   female  male
0      47    81
1      22    35
2      82    30
3      19   111
4      85    60
The T-Test formula is the following:
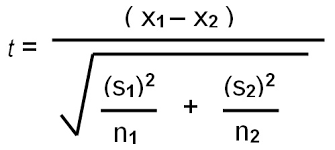
In the formula X1 and X2 are the means of the two populations and S1, S2 are the standard deviations. Let’s compute it.
se_male=df.std()['male']/np.sqrt(10)

se_female=df.std()['female']/np.sqrt(10)

sed=np.sqrt((se_male**2) + (se_female**2))

t_stat=(df.mean()['male'] - df.mean()['female'])/sed
print(t_stat)
1.4975967856987693
Now Having the T statistic we have to find the critical number at the T statistic table. In our case is a one-tailed test because we want to test if the number of likes of males is bigger than the likes of females. It could be two-tailed test if we wanted to test just if the means of the two populations are not equal.
Also, we need the degrees of freedom which is number of samples of male + number of samples of female -2.
dof=10+10-2=18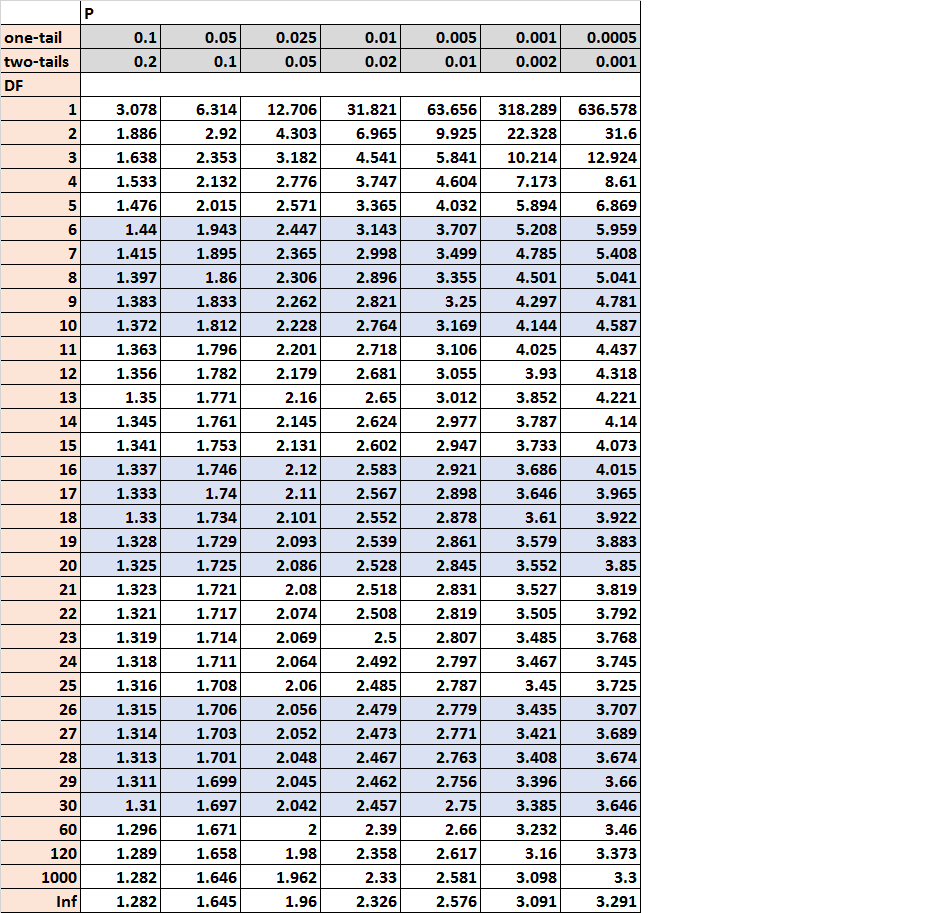
As we can see in our table, the critical value for one tail, DOF=18 and significance level of 0.05 is 1.734. Our T statistic was 1.49 which is smaller than 1.734 thus we will not reject the Null Hypothesis.
T-Test using Scipy
Now, we will show you how to do it using scipy in one line of code.
t_stat, p = ttest_ind(df['male'], df['female'])
print(f't={t_stat}, p={p}')
t=1.4975967856987693, p=0.15156916509799923
We are getting the same results as before for the T statistic but be careful because the P-value here is wrong. This function returns the p-value for the two-tailed test and we want left-tailed. What we can do is to run the following function with our t statistic and the DOF.
#right-tailed
t.sf(t_stat, 18)

#for left-tailed we have to run
#t.cdf(t_stat, DOF)

#or you can just divide p by 2
#p/2
0.07578458254899961
As we can see we are getting 0.075 which is bigger than 0.05 thus we will not reject the NULL Hypothesis.


4 thoughts on “How to Perform a Student’s T-test in Python”
You could also simply divide the two-sided p-value by two, which gives you the one-sided one: 0.15156916509799923/2 = 0.07578458254899961
You are right! Thanks
It depends on the distribution symmetry
This whole thing is assuming normal distribution