
Python gives us the option to make xkcd style plots using the matplotlib library. For the plots we will use Pandas. The trick is to use the command with plt.xkcd():and then the Pandas plot will be converted to xkcd style.
Bar Plots
For every case, we will provide reproducible code.
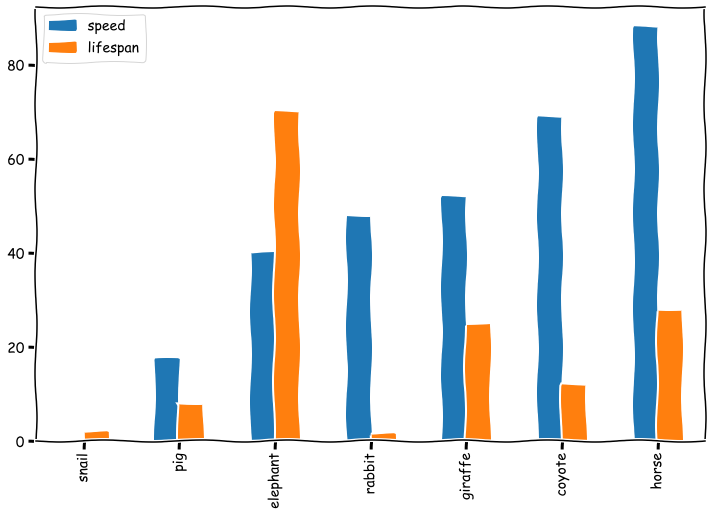
speed = [0.1, 17.5, 40, 48, 52, 69, 88]
lifespan = [2, 8, 70, 1.5, 25, 12, 28]
index = ['snail', 'pig', 'elephant', 'rabbit', 'giraffe', 'coyote', 'horse']
df = pd.DataFrame({'speed': speed,  'lifespan': lifespan}, index=index)

with plt.xkcd():
    plt.rcParams['figure.figsize'] = [12, 8]
    # This figure will be in XKCD-style
    fig1 = plt.figure()
    ax = df.plot.bar()
Scatter Plots
df = pd.DataFrame([[5.1, 3.5, 0], [4.9, 3.0, 0], [7.0, 3.2, 1], [6.4, 3.2, 1], [5.9, 3.0, 2]],
                      columns=['length', 'width', 'species'])

with plt.xkcd():
    plt.rcParams['figure.figsize'] = [12, 8]
    # This figure will be in XKCD-style
    fig1 = plt.figure()
    ax = df.plot.scatter(x='length', y='width')

Line Plots
df = pd.DataFrame({
   'pig': [20, 18, 489, 675, 1776],
   'horse': [4, 25, 281, 600, 1900]
   }, index=[1990, 1997, 2003, 2009, 2014])

with plt.xkcd():
    plt.rcParams['figure.figsize'] = [12, 8]
    # This figure will be in XKCD-style
    fig1 = plt.figure()
    ax = df.plot.line()

Density Plots
df = pd.DataFrame({
    'x': [1, 2, 2.5, 3, 3.5, 4, 5],
    'y': [4, 4, 4.5, 5, 5.5, 6, 6],
})

with plt.xkcd():
    plt.rcParams['figure.figsize'] = [12, 8]
    # This figure will be in XKCD-style
    fig1 = plt.figure()
    ax = df.plot.kde()

Area Plot
df = pd.DataFrame({
    'sales': [3, 2, 3, 9, 10, 6],
    'signups': [5, 5, 6, 12, 14, 13],
    'visits': [20, 42, 28, 62, 81, 50],
}, index=pd.date_range(start='2018/01/01', end='2018/07/01',
                       freq='M'))

with plt.xkcd():
    plt.rcParams['figure.figsize'] = [12, 8]
    # This figure will be in XKCD-style
    fig1 = plt.figure()
    ax = df.plot.area()


