

You may have heard the terms “bull” and “bear” markets, which are terms to describe a trend in the market. There are different ways to detect trends, but the most popular one is the Average Directional Movement Index (ADX).
The ADX Formula
In order to derive the ADX, first, we will need to calculate the positive and negative directional indicators, +DI and -DI respectively. Before we get the directional indicators, we need to get the direction movements, +DM and -DM respectively.
- UpMove = today’s high − yesterday’s high
- DownMove = yesterday’s low − today’s low
- if UpMove > DownMove and UpMove > 0, then +DM = UpMove, else +DM = 0
- if DownMove > UpMove and DownMove > 0, then -DM = DownMove, else -DM = 0
Then we usually consider a 14-day period and the +DI and -DI are calculated as follows:
- +DI = 100 times the smoothed moving average of (+DM) divided by average true range
- -DI = 100 times the smoothed moving average of (-DM) divided by average true range
Finally, we are in a position to calculate the ADX as follows:
- ADX = 100 times the smoothed moving average of the absolute value of (+DI − -DI) divided by (+DI + -DI)
Interpretation
The ADX is a tool that measures the strength of a trend. It is a lagging indicator, which means that it takes a while for it to give a signal that a trend is happening. The ADX ranges from 0 to 100. A low number means that the trend is weak, and a high number means that the trend is strong. A really strong trend is indicated by a number over 50.
Trends in Bitcoin
Let’s get the trends in Bitcoin since 2022. We will get the data using the Kraken API. Let’s get the OHLC data.
import pandas as pd
import requests
import time
import datetime
import talib
import numpy as np

import matplotlib.pyplot as plt
%matplotlib inline


epoch = datetime.datetime(2022, 1, 1, 0, 0, 0).timestamp()

# BITCOIN over USD
pair = 'XXBTZUSD'


url = f'https://api.kraken.com/0/public/OHLC?pair={pair}&since={epoch}&interval=1440'.format(pair,epoch)
resp = requests.get(url)
df = pd.DataFrame(resp.json()['result'][pair])
df.columns = ['unixtimestap', 'Open', 'High', 'Low', 'Close', 'vwap', 'volume', 'count']
df['unixtimestap'] = pd.to_datetime(df['unixtimestap'], unit='s')
df.set_index('unixtimestap', inplace=True)
df = df[['Open', 'High', 'Low', 'Close']]
df['Open'] = df['Open'].astype('float')
df['High'] = df['High'].astype('float')
df['Low'] = df['Low'].astype('float')
df['Close'] = df['Close'].astype('float')
df

Let’s get the ADX with a rolling window of a 14-day period using the talib Python library.
# Calculate the ADX with the default time period
df['ADX_14'] = talib.ADX(df['High'], df['Low'], df['Close'], timeperiod=14)
Let’s build a function that returns:
- “No Trend” when ADX<=25
- “Mild Trend” when 25<ADX<=50
- “Strong Trend” when ADX>50
def adx_trend(x):
    if x<=25:
        return "No Trend"
    if x>50:
        return "Strong Trend"
    if x>25:
        return "Mild Trend"


df['ADX_Trend'] = df['ADX_14'].apply(lambda x:adx_trend(x))

df.tail(20)
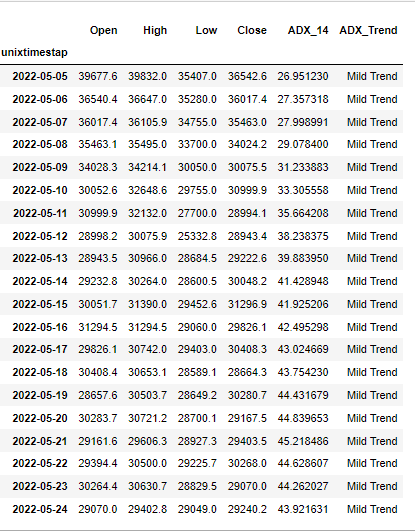
As we can see, during this time period (i.e. the last 20 days) there is a moderate trend in the market. Let’s have a look at the graph of the closing prices of Bitcoin, annotating the labels of the trend when there is a mild or strong trend.
ax = df.Close.plot(figsize=(30,15), title= "Trends")
for i in range(df.shape[0]):
    label = df.ADX_Trend[i]
    if label=='Strong Trend' or label=='Mild Trend':
        ax.annotate(label,
             (df.index[i], df['Close'][i]),
             xytext=(0, 15),
             textcoords='offset points',
             arrowprops=dict(arrowstyle='-|>'), color='r', ha='center')

Related Articles
- How to Apply an RSI Trading Strategy to your Cryptos
- How to get the ROI of your Cryptocurrencies with Kraken API
- Get the Portfolio Balance with Kraken API
- Cryptocurrency Portfolio Optimization in Python
- How to get the most and least Volatile Cryptocurrencies
- How to Get Cryptocurrency Data from Kraken API in Python
- Retweet Network Analysis in Cryptocurrencies


