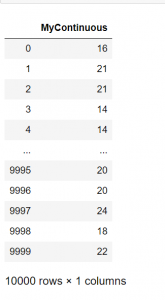
We will show how you can create bins in Pandas efficiently. Let’s assume that we have a numeric variable and we want to convert it to categorical by creating bins.
We will consider a random variable from the Poisson distribution with parameter λ=20
import numpy as np
import pandas as pd
import matplotlib.pyplot as plt
%matplotlib inline
s = np.random.poisson(20, 10000)

df = pd.DataFrame({'MyContinuous':s})

df

Let’s get the histogram as well.
df.hist('MyContinuous', bins=10, figsize=(12,8))

Create Specific Bins
Let’s say that you want to create the following bins:
- Bin 1: (-inf, 15]
- Bin 2: (15,25]
- Bin 3: (25, inf)
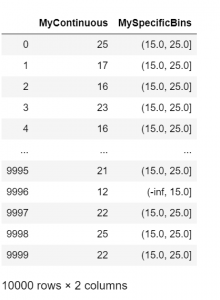
We can easily do that using pandas. Let’s start:
bins = [-np.inf, 15, 25, np.inf]
df['MySpecificBins'] = pd.cut(df['MyContinuous'], bins)
df

Let’s have a look at the counts of each bin.
df['MySpecificBins'].value_counts()
(15.0, 25.0]    7341
(-inf, 15.0]    1552
(25.0, inf]     1107
Name: MySpecificBins, dtype: int64
Notice that you can define also you own labels within the cut function.
Create Bins based on Quantiles
Let’s say that you want each bin to have the same number of observations, like for example 4 bins of an equal number of observations, i.e. 25% each. We can easily do it as follows:
df['MyQuantileBins'] =  pd.qcut(df['MyContinuous'], 4)

df[['MyContinuous', 'MyQuantileBins']].head()

We can check the MyQuantileBins if contain the same number of observations, and also to look at their ranges:
df['MyQuantileBins'].value_counts()
(4.999, 17.0]    2996
(17.0, 20.0]     2628
(20.0, 23.0]     2239
(23.0, 39.0]     2137
Name: MyQuantileBins, dtype: int64
Want to Build Bins in R?
Do you want to create bins in R? You can have a look at our post.
More Data Science Hacks?
You can follow us on Medium for more Data Science Hacks


2 thoughts on “How to create Bins in Python using Pandas”
Can you share how to create bins for categorical variables such as interest rates
15%
I do not get the question