We have written many posts related to stocks. A good way to represent the stock prices as time series is with Candlestick Charts.

Let’s see how we can easily produce candlestick charts with R. We will work with the quantmod library and with the AMZN stock.
library("quantmod")
# get the Amazon Stock data
Amazon<-getSymbols("AMZN",
from = "2020-01-01",
to = "2021-03-17",
periodicity = "daily",
auto.assign=FALSE)
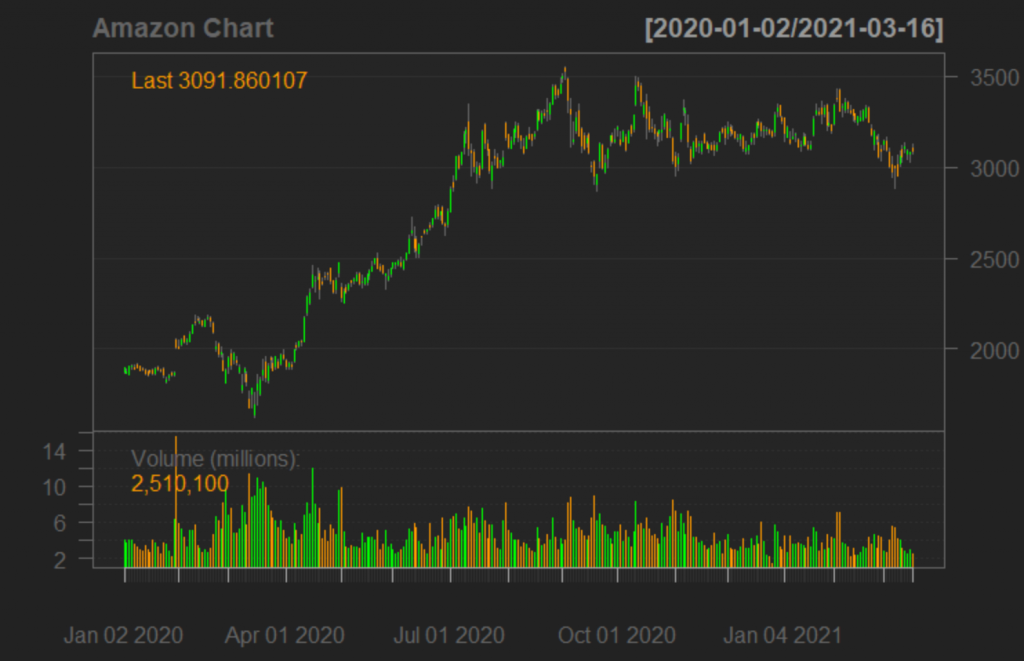
chartSeries(Amazon, name="Amazon Chart")
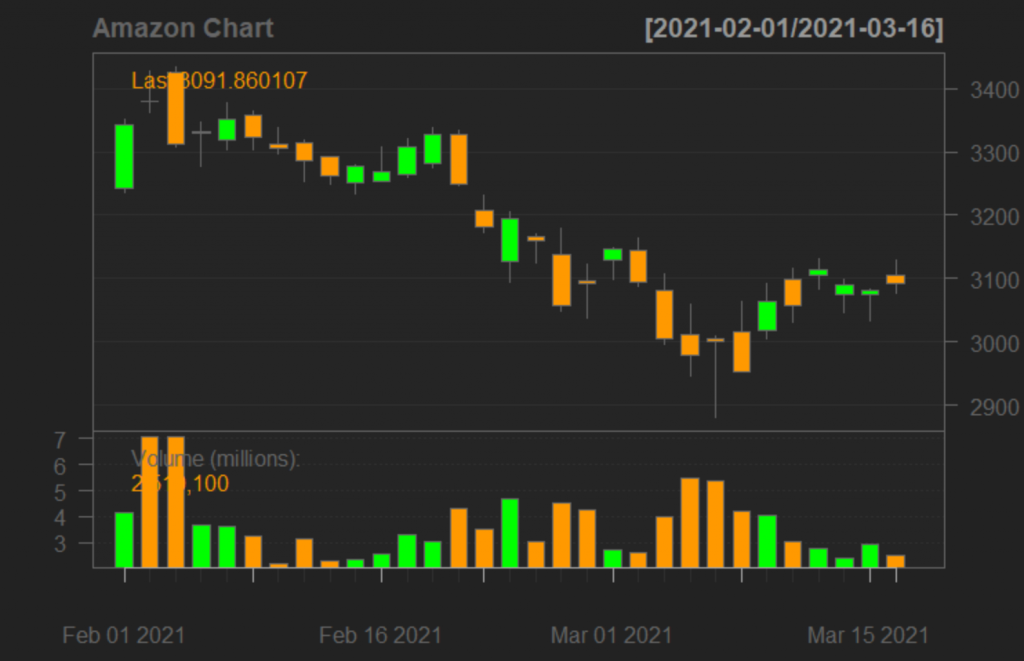
chartSeries(Amazon, name="Amazon Chart", subset = "last 2 months")
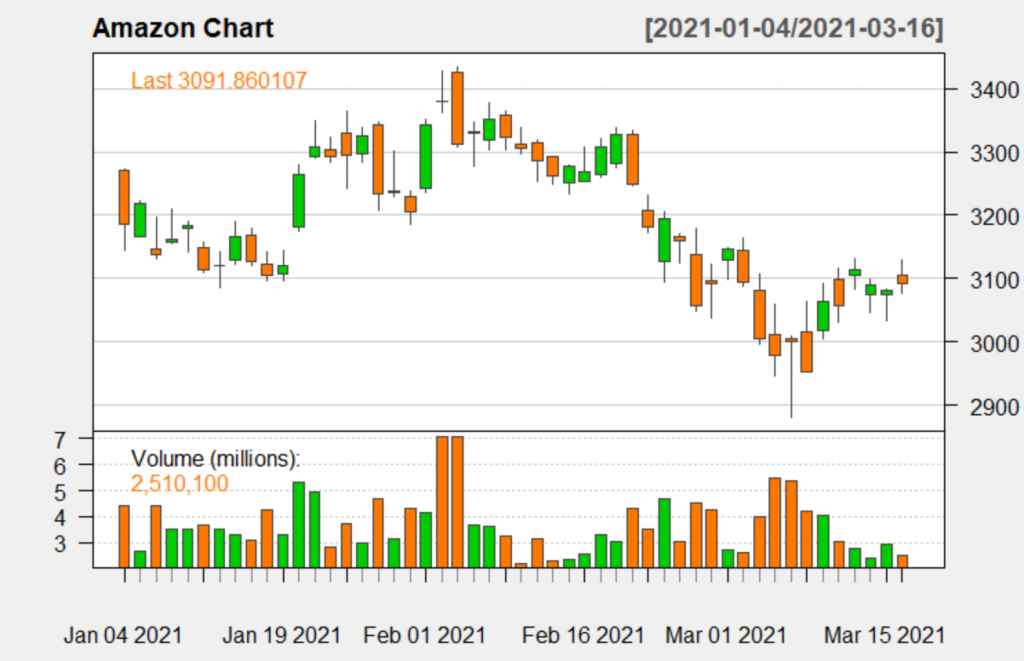
chartSeries(Amazon, name="Amazon Chart", subset = "2021", theme="white")